expense tracker
تفاصيل العمل
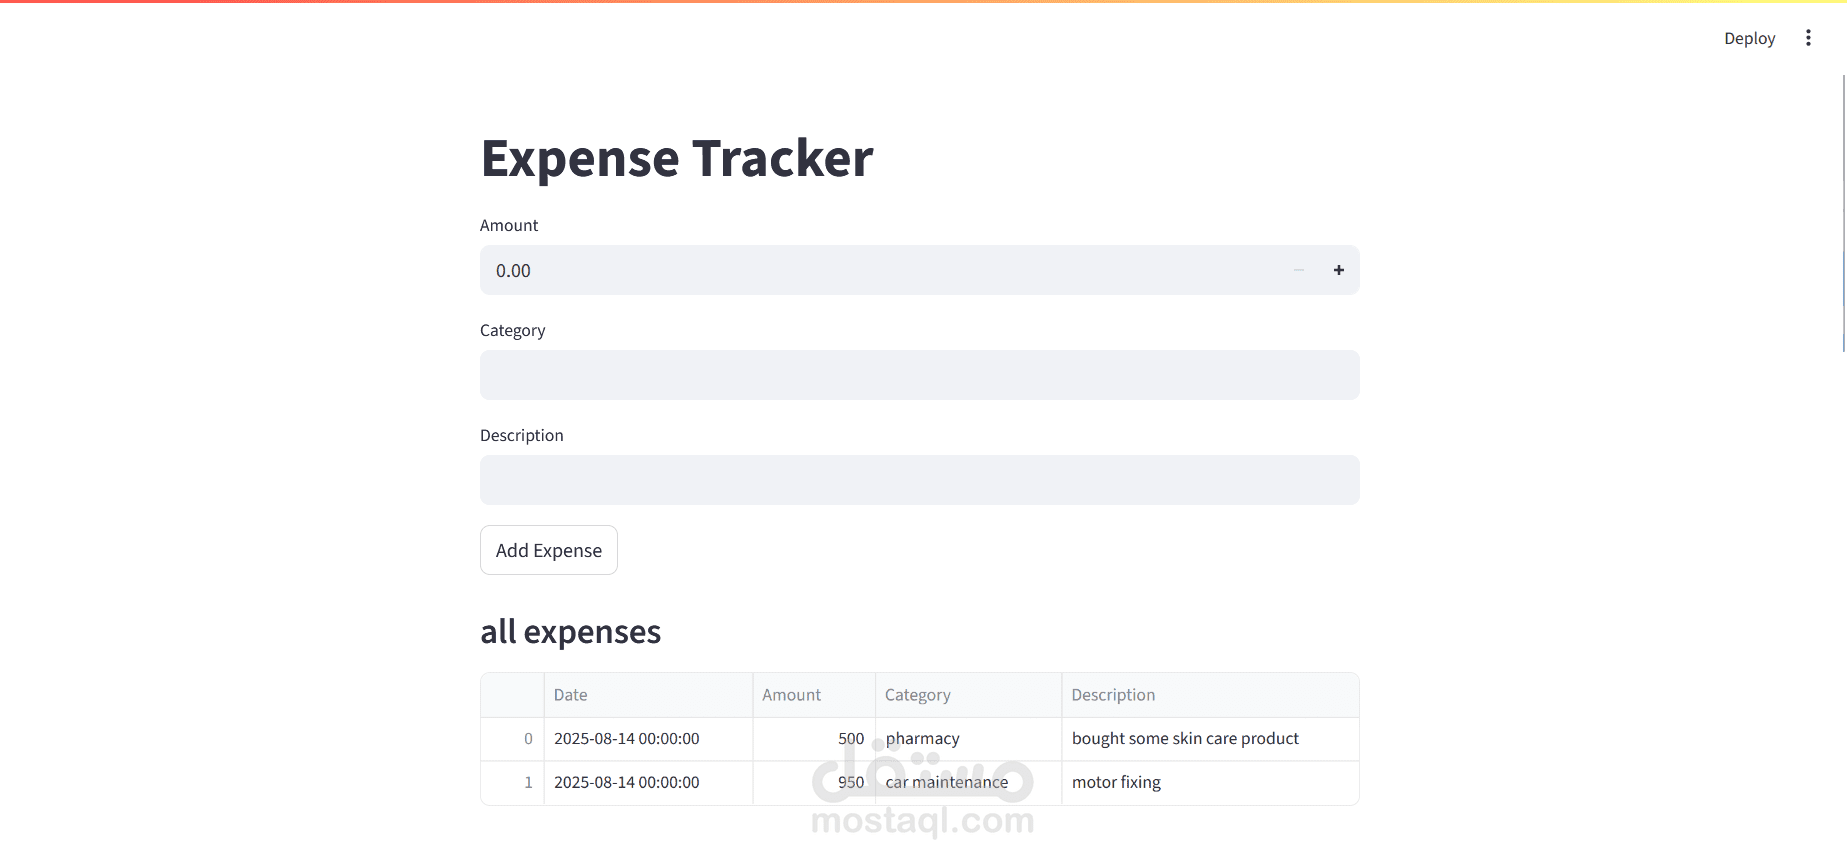
The Expense Tracker is a Python application that helps users record, manage, and visualize their daily expenses. It stores expense data in a CSV file and provides interactive charts to track spending trends by category and over time. This project demonstrates Python data handling, Pandas, Matplotlib/Streamlit, and GUI/web app development skills — making it ideal for a portfolio.
Features
Add expenses with amount, category, date, and description
View all expenses in a table or dashboard
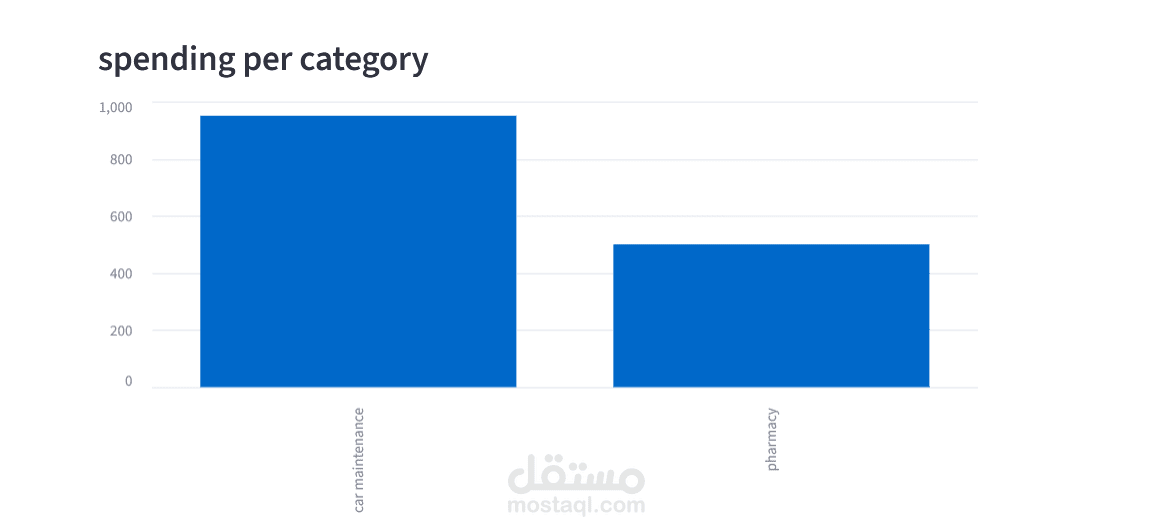
Visualize spending with bar charts (by category) and line charts (monthly trends)
Filter expenses by category and date range (Streamlit version)
Optional GUI using Tkinter or interactive web app via Streamlit
The Expense Tracker is a Python application that helps users record, manage, and visualize their daily expenses. It stores expense data in a CSV file and provides interactive charts to track spending trends by category and over time. This project demonstrates Python data handling, Pandas, Matplotlib/Streamlit, and GUI/web app development skills — making it ideal for a portfolio. Features Add expenses with amount, category, date, and description View all expenses in a table or dashboard Visualize spending with bar charts (by category) and line charts (monthly trends) Filter expenses by category and date range (Streamlit version) Optional GUI using Tkinter or interactive web app via Streamlit
Skills: Python (Programming Language) · streamlit · Pandas (Software) · Matplotlib · Computerized System Validation (CSV) · Data Visualization