KPI Dashboard for Business Performance
تفاصيل العمل
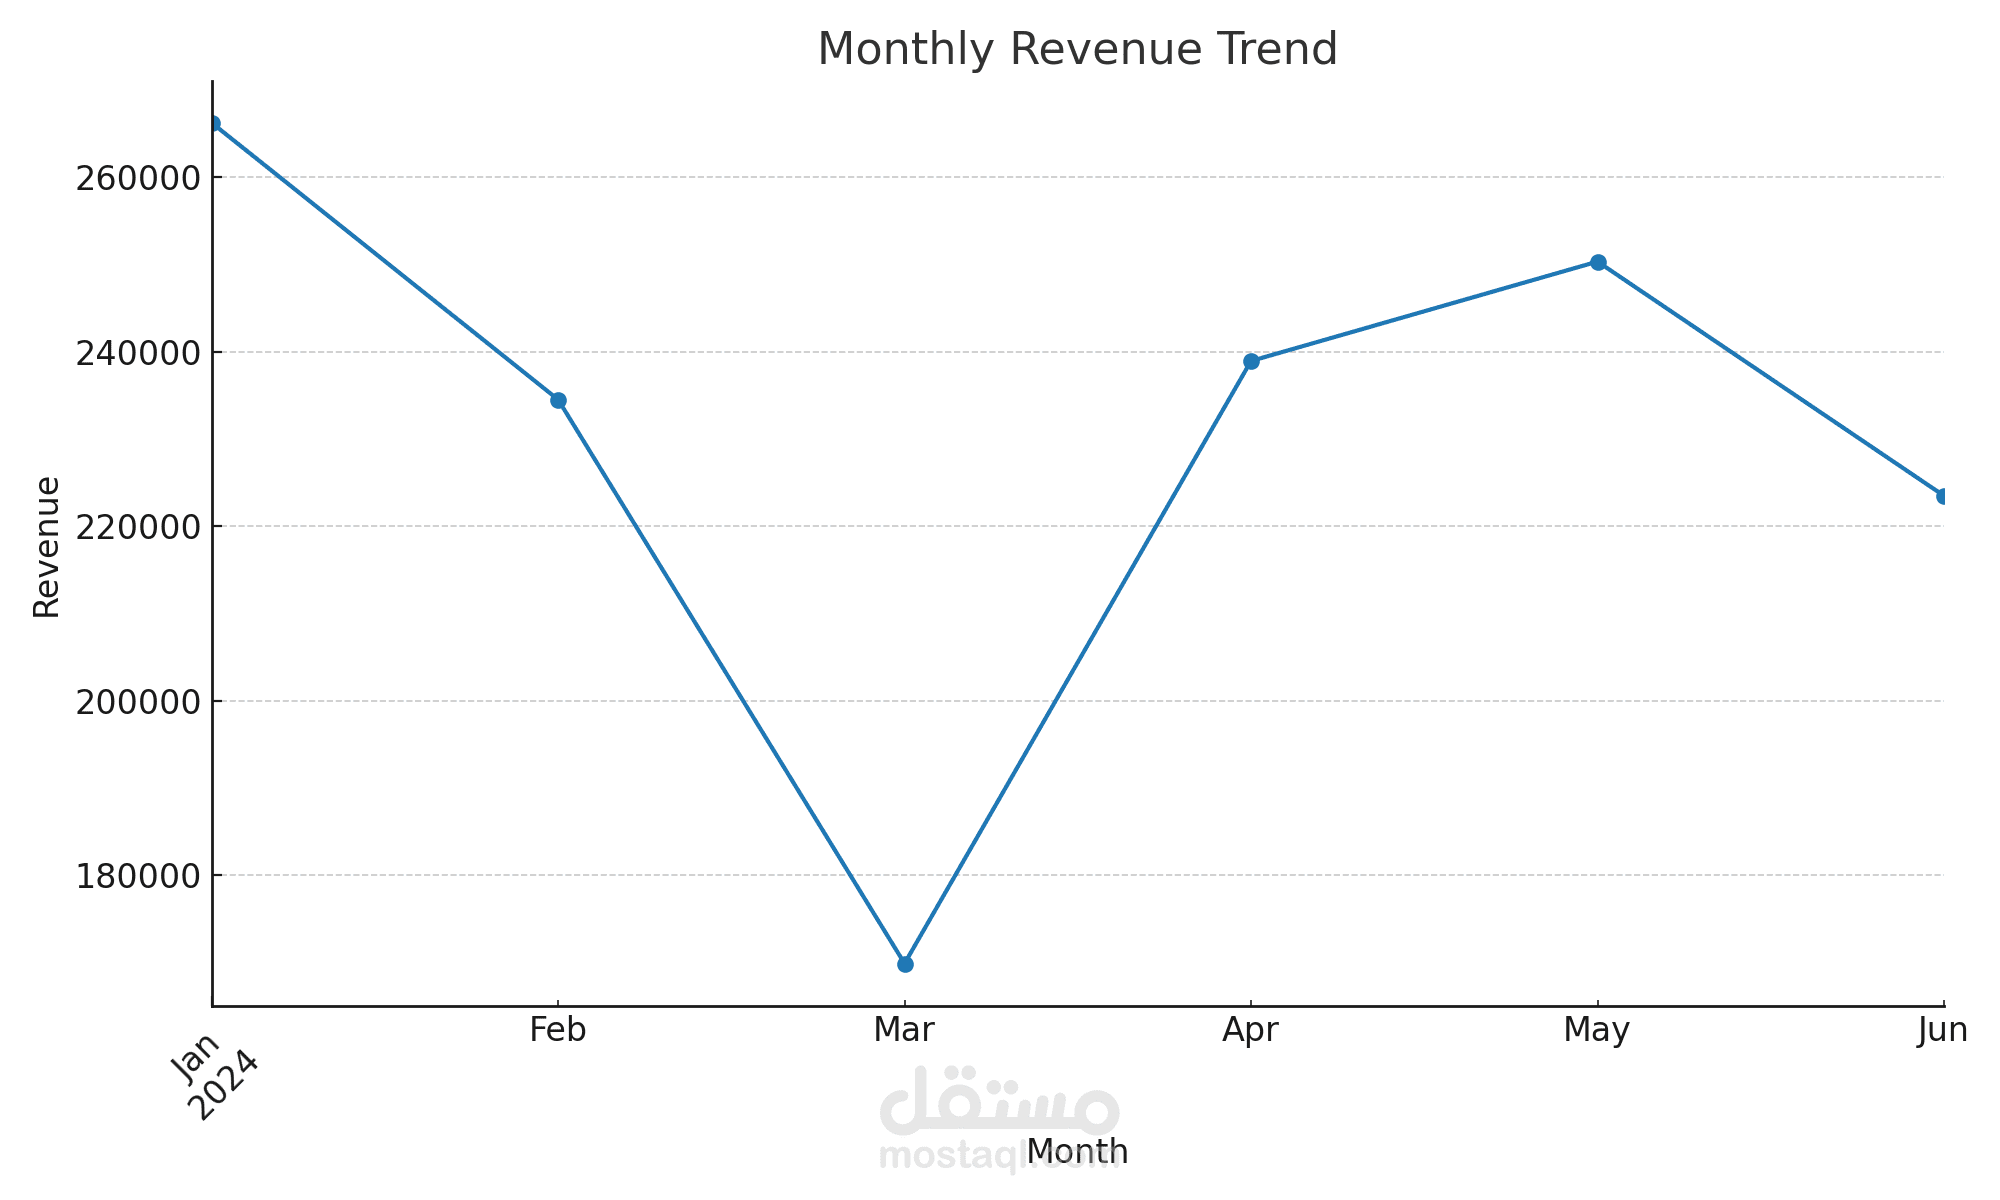
Developed an interactive KPI dashboard to track the company’s performance. The dashboard included monthly revenue, target comparison, customer acquisition, and churn rate.
Tools Used: Power BI – Excel
Outcome: Built a real-time dashboard that allows decision-makers to monitor progress against targets, identify growth opportunities, and make data-driven decisions effectively.