Data Analyst Portfolio Project | Pizza Sales Report (Power BI + SQL)
تفاصيل العمل
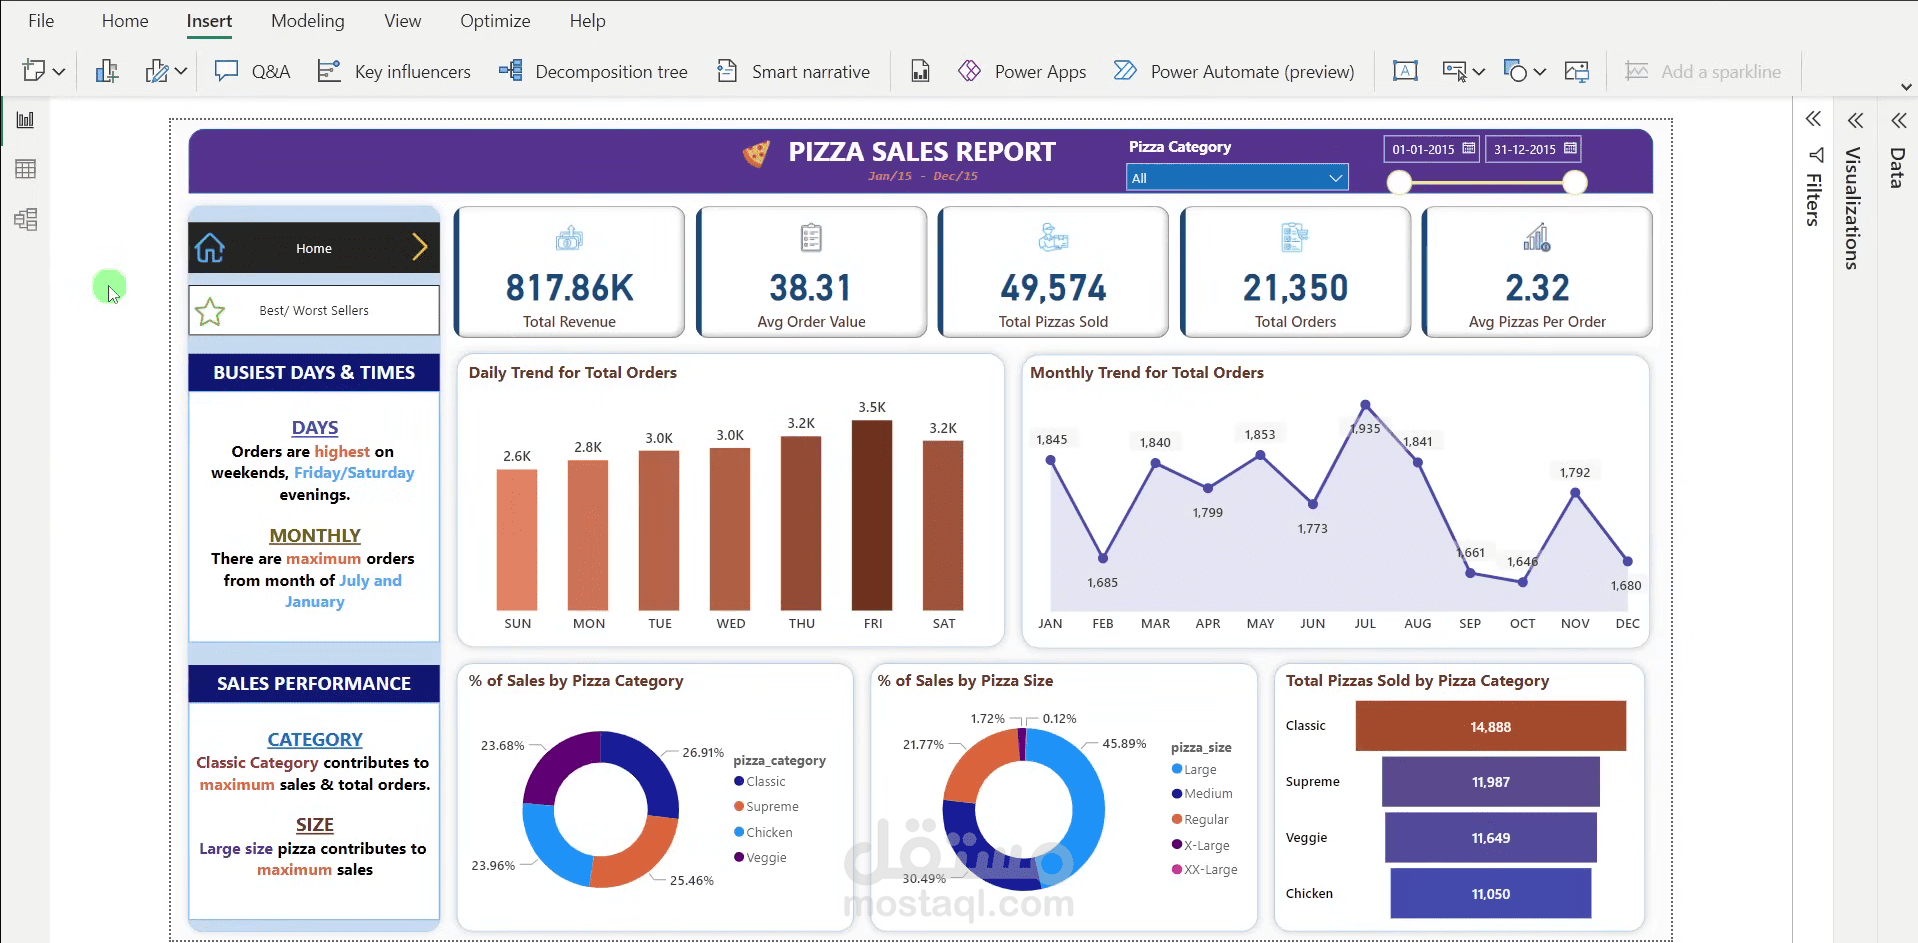
تم تطوير لوحة معلومات مبيعات تفاعلية باستخدام Power BI لتحليل أداء مبيعات البيتزا.
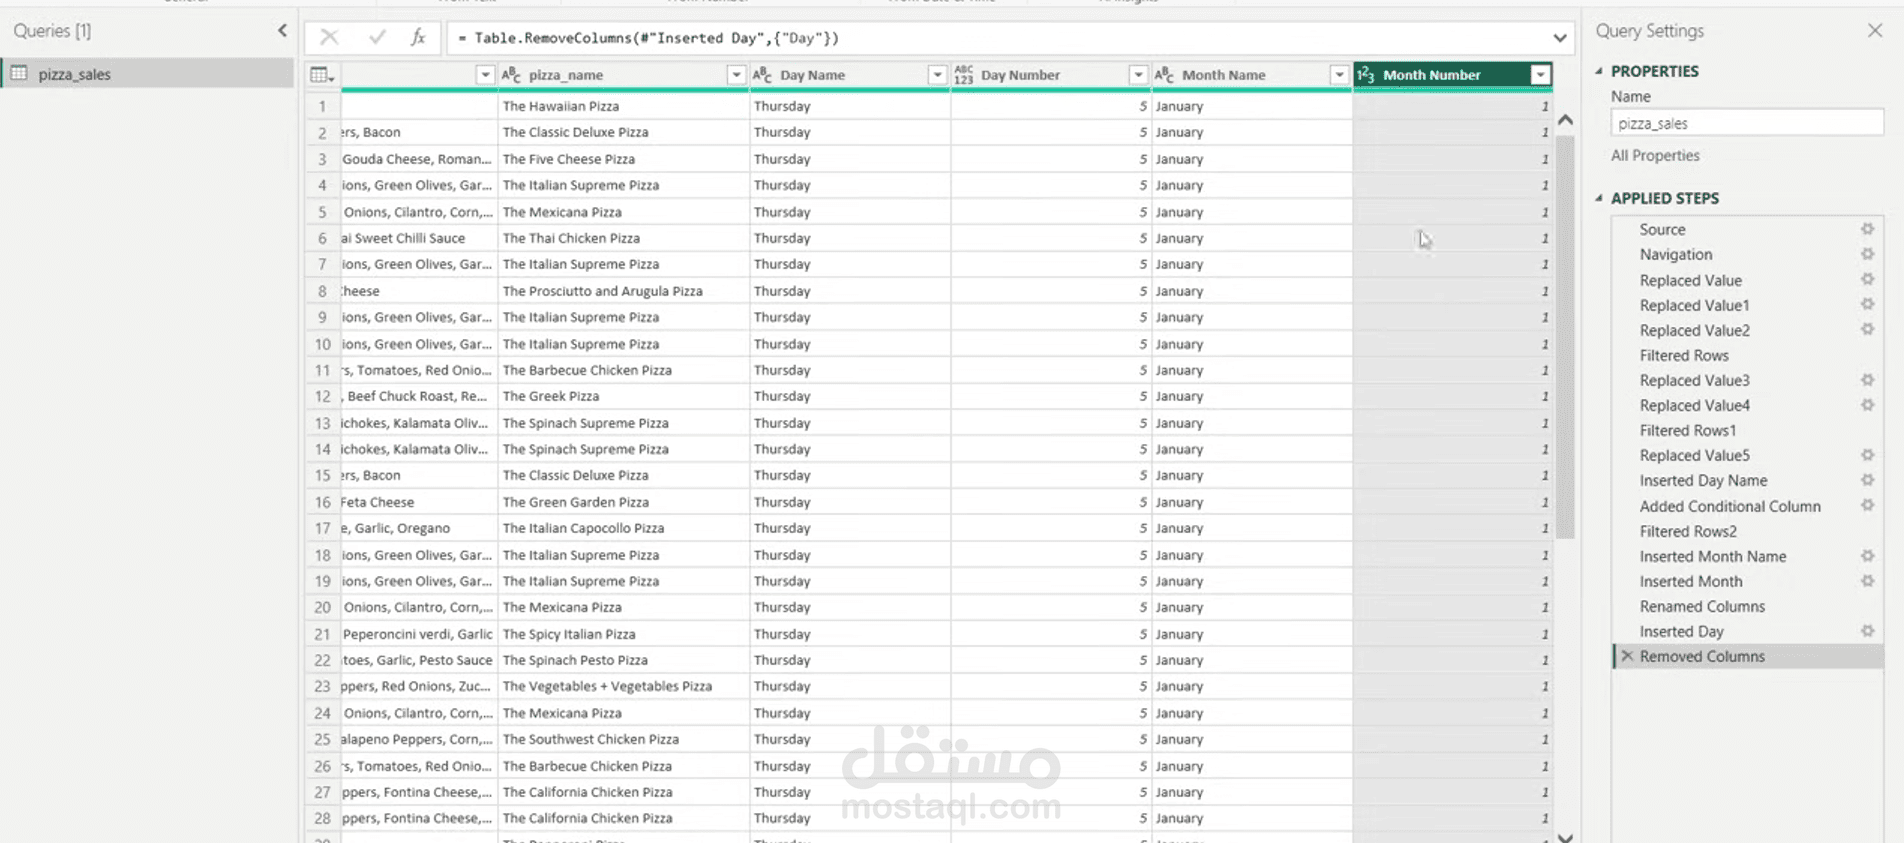
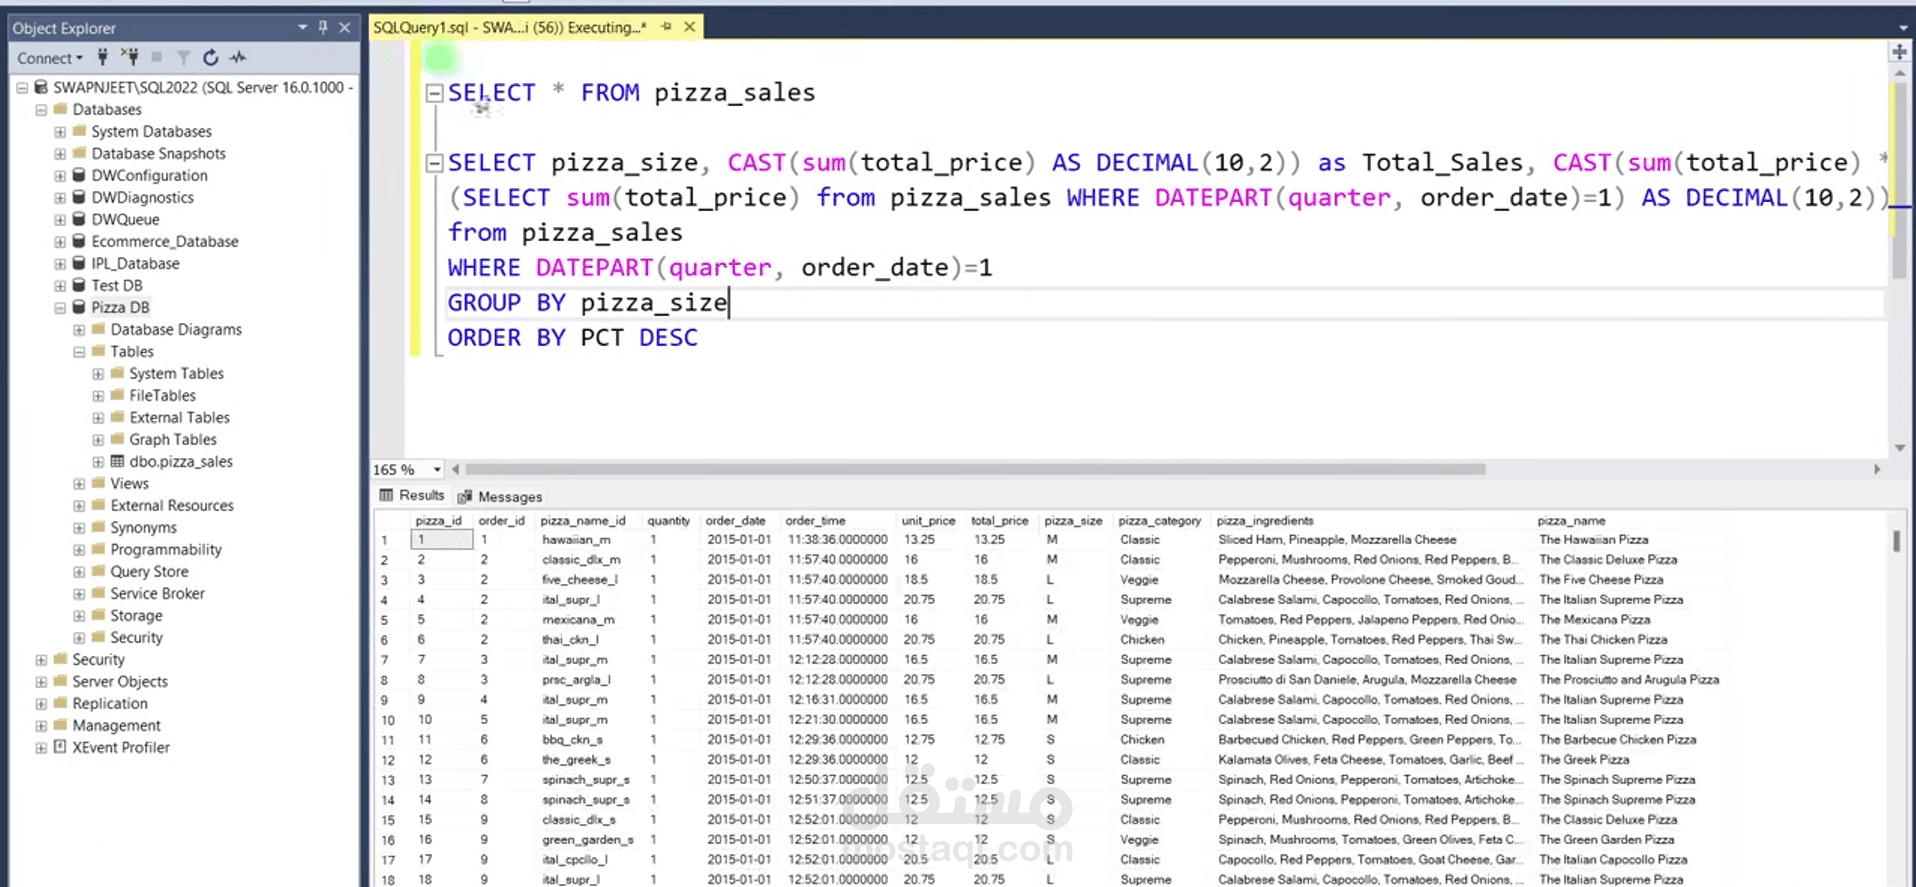
تم استيراد البيانات وتنقيحها من قاعدة بيانات SQL، وتطبيق نمذجة البيانات، وإنشاء مؤشرات الأداء الرئيسية (KPIs).
تم عرض رؤى بصرية مثل إجمالي الإيرادات، وأكثر الأيام والأوقات ازدحامًا، واتجاهات الطلبات الشهرية، وأداء المبيعات حسب كل فئة.
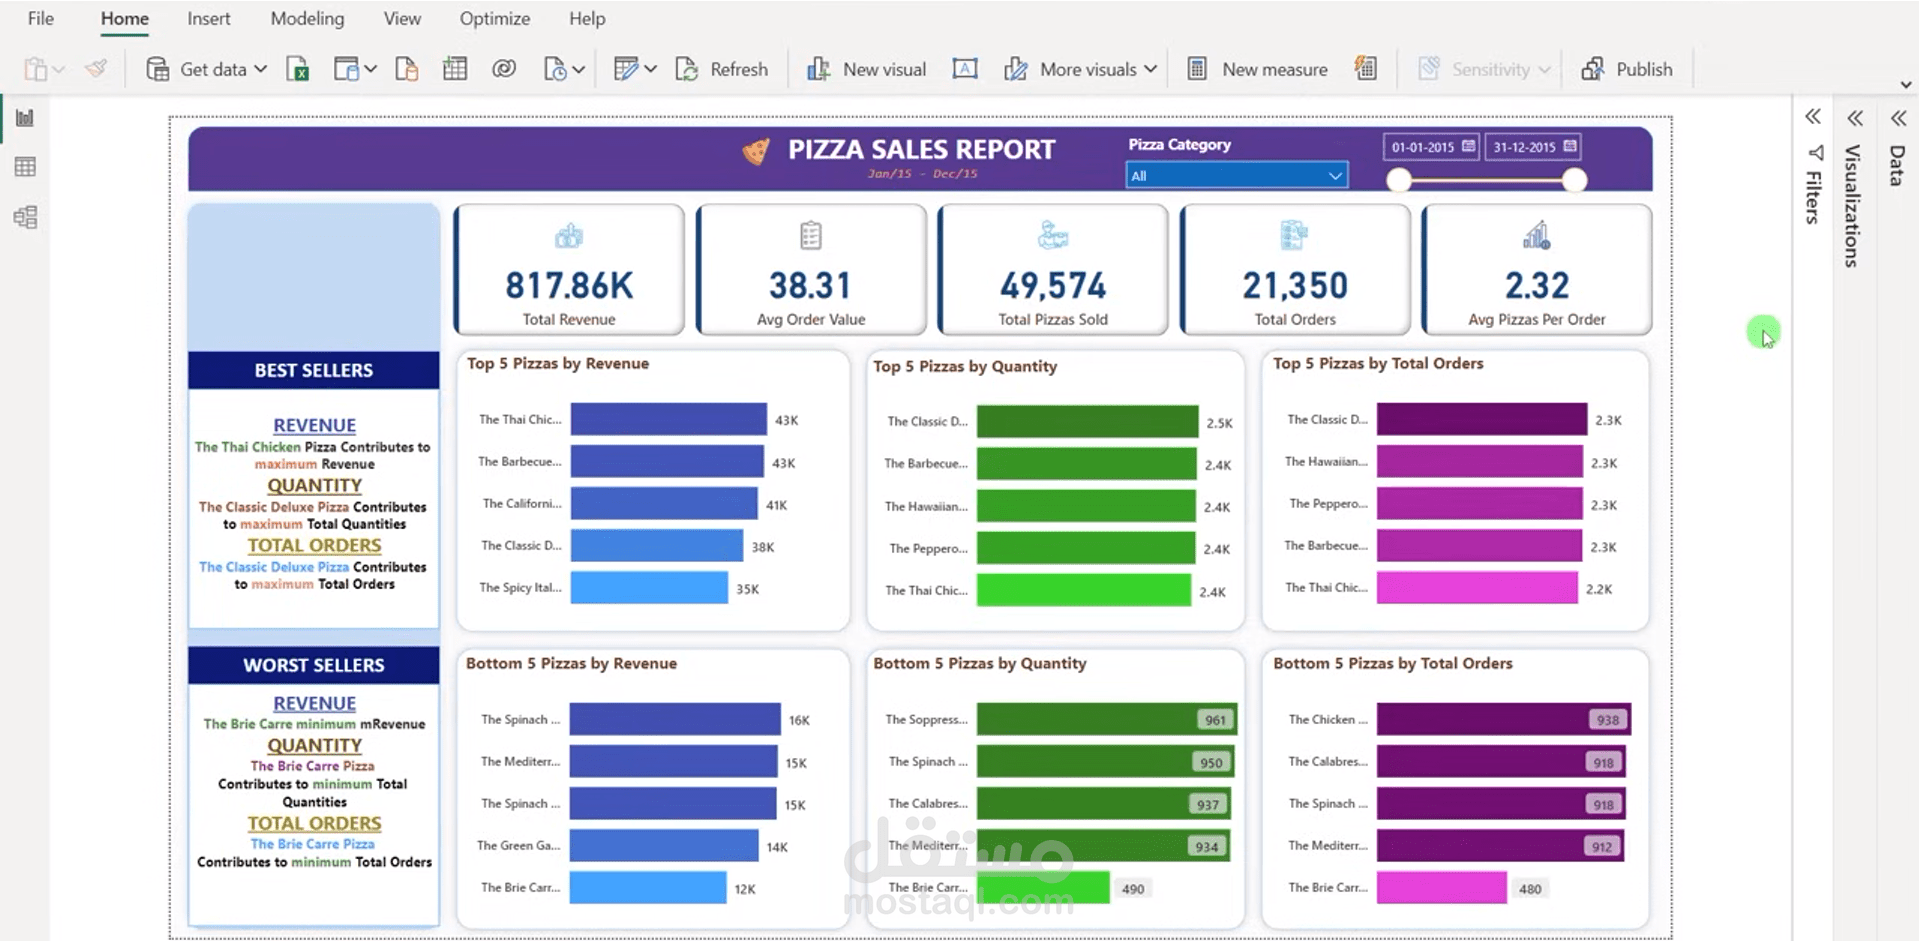
تم تصميم مخططات بيانية دائرية وشريطية وخطية لعرض توزيع المبيعات حسب الفئة والحجم وتكرار الطلبات.
تم تقديم رؤى عملية لاتخاذ القرارات، مثل تحديد فترات ذروة المبيعات وفئات البيتزا الأفضل أداءً.