Interactive Sales & Profit Analysis Dashboard
تفاصيل العمل
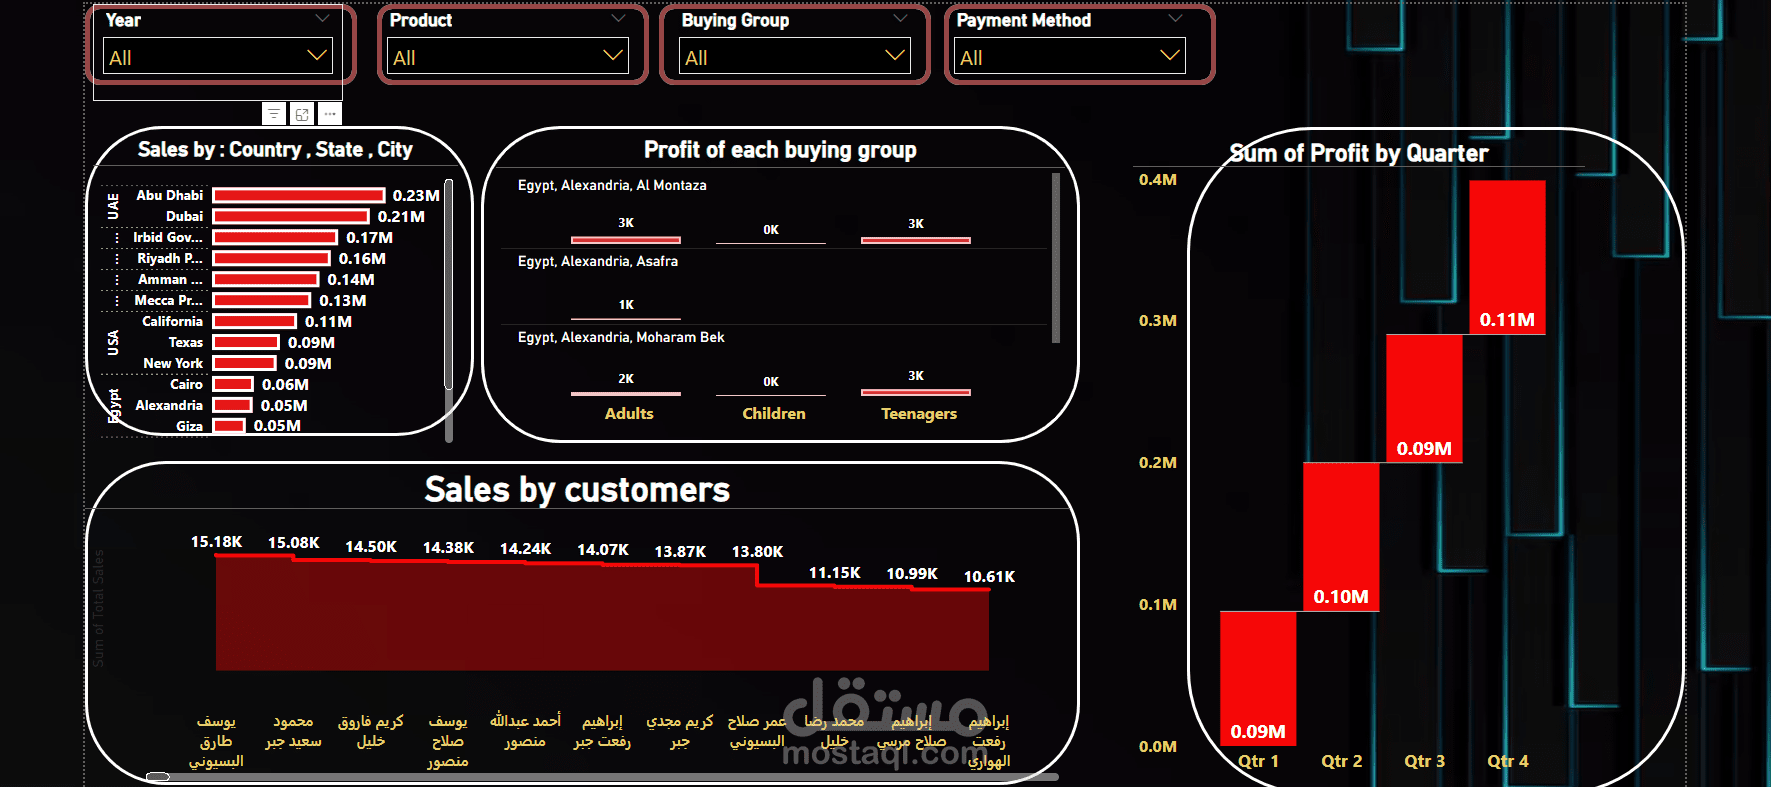
The goal of the project was to create an interactive and dynamic report that helps business decision-makers analyze regional sales performance, evaluate customer contributions, and track profit trends across buying groups and quarters.
Key insights provided by the dashboard :-
Sales by Country, State & City
Abu Dhabi → 0.23M
Dubai → 0.21M
Irbid Gov. → 0.17M
Riyadh → 0.16M
Amman → 0.14M
Mecca → 0.13M
California → 0.11M
Texas → 0.09M
New York → 0.09M
Cairo → 0.06M
Alexandria → 0.06M
Giza → 0.05M
Profit by Buying Group (Alexandria regions example):
Al Montaza → Adults: 3K | Children: 0K | Teenagers: 3K
Asafra → Adults: 1K | Children: 0K | Teenagers: 0K
Moharam Bek → Adults: 2K | Children: 0K | Teenagers: 3K
Profit by Quarter:
Q1 → 0.09M
Q2 → 0.10M
Q3 → 0.09M
Q4 → 0.11M
Top Customers by Sales:
يوسف البيسوني → 15.18K
محمود سعيد جبر → 15.08K
كريم فاروق خليل → 14.50K
يوسف منصور → 14.38K
أحمد عبدالله صلاح → 14.24K
عمر صلاح البيسوني → 13.87K
كريم مجدي جبر → 13.80K
محمد رضا خليل → 11.15K
إبراهيم صلاح مرسي → 10.99K
إبراهيم رفعت الهواري → 10.61K
---
Visual elements include :-
Bar chart showing sales by country, state, and city
Comparative chart showing profit by buying group
Column chart visualizing profit by quarter
Horizontal bar chart visualizing sales by customers