Sales Dashboard
تفاصيل العمل
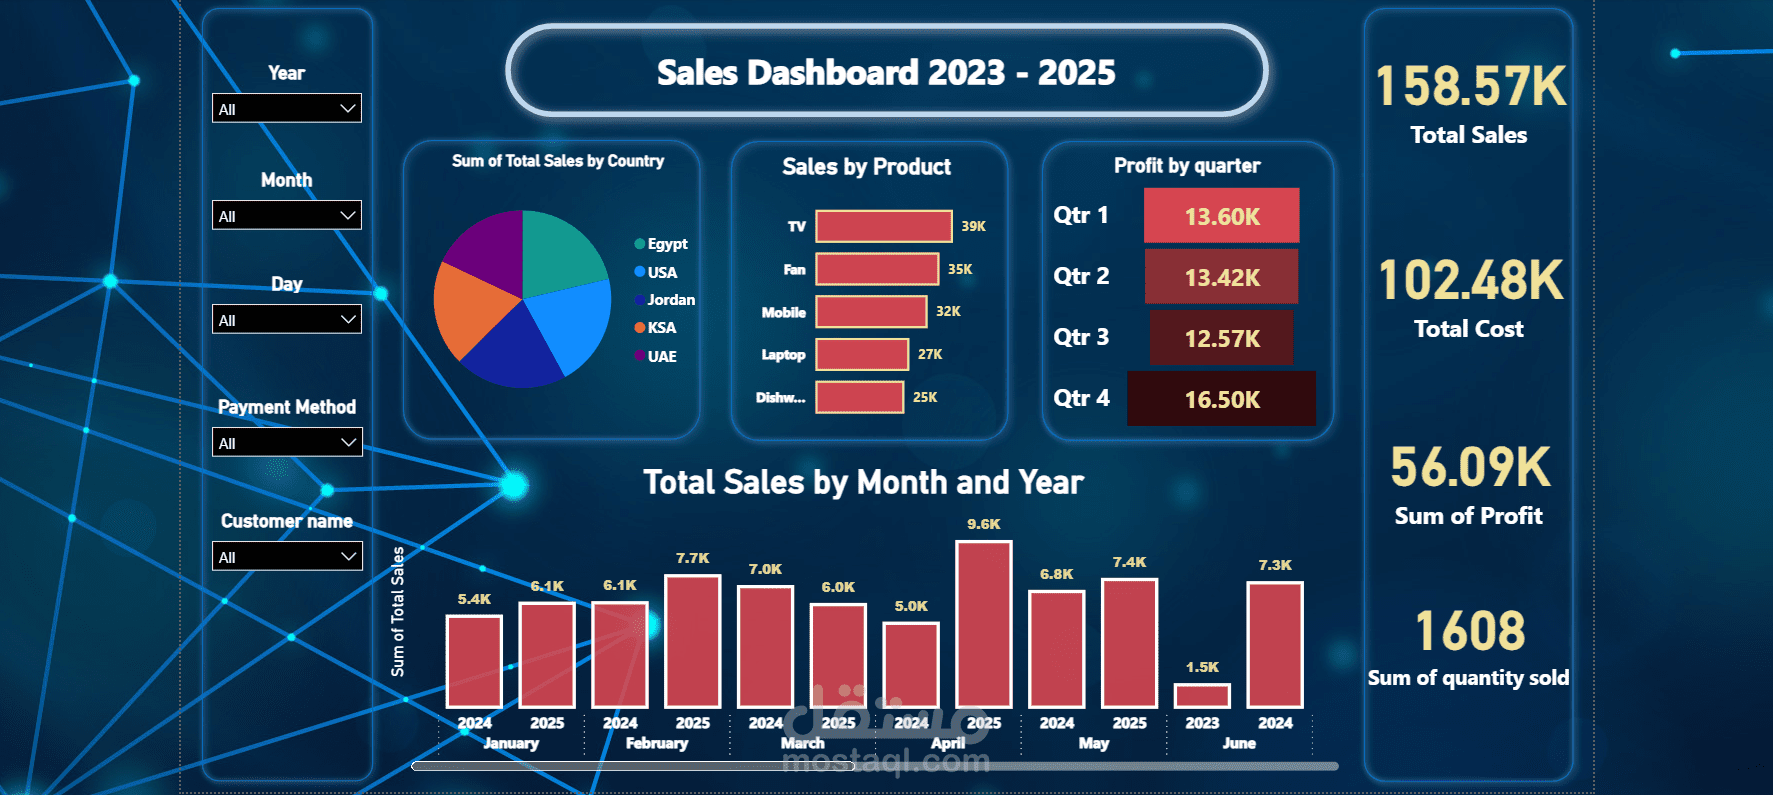
The goal of the project was to create an interactive and dynamic report that helps business decision-makers quickly understand sales performance, identify top-selling products, highest-value customers and the most profitable countries ️
● Key insights provided by the dashboard :-
Total sales
Total cost
Sum of profit
Sum of quantity sold ️
● Visual elements include :-
A bar chart visualizing total sales by product ▪︎
A funnel visualizing profit for each quarter ▪︎
A column chart visualizing sales by M & Y ▪︎
A pie chart visualizing total sales by country ▪︎