Assignment Dated 17 AUG 2025
تفاصيل العمل
Power BI Project – Retail Sales Data Cleaning & Simple Dashboard
Scenario:
You are a junior Data Analyst at a retail company. You’ve been given raw transaction data that needs basic cleaning in Power Query and then used to create a simple Power BI dashboard for management.
---
1. Data Cleaning in Power Query
Perform only the following steps:
1. Check & Correct Data Types
Transaction ID → Text
Date → Date
Units Sold → Whole Number
Unit Price & Total Revenue → Decimal Number (currency format applied after loading)
Region & Payment Method → Text
2. Rename Columns
Ensure clear and consistent names (e.g., ProductCategory → Product Category).
3. Fix Formatting Issues
Remove leading/trailing spaces in text fields.
Capitalize each word in Product Category and Region.
4. Handle Missing or Incorrect Data
Replace blank/null values with "Unknown" for text and 0 for numbers.
Remove duplicate rows.
5. Sort & Reorder Columns
Order: Transaction ID, Date, Product Category, Product Name, Units Sold, Unit Price, Total Revenue, Region, Payment Method.
---
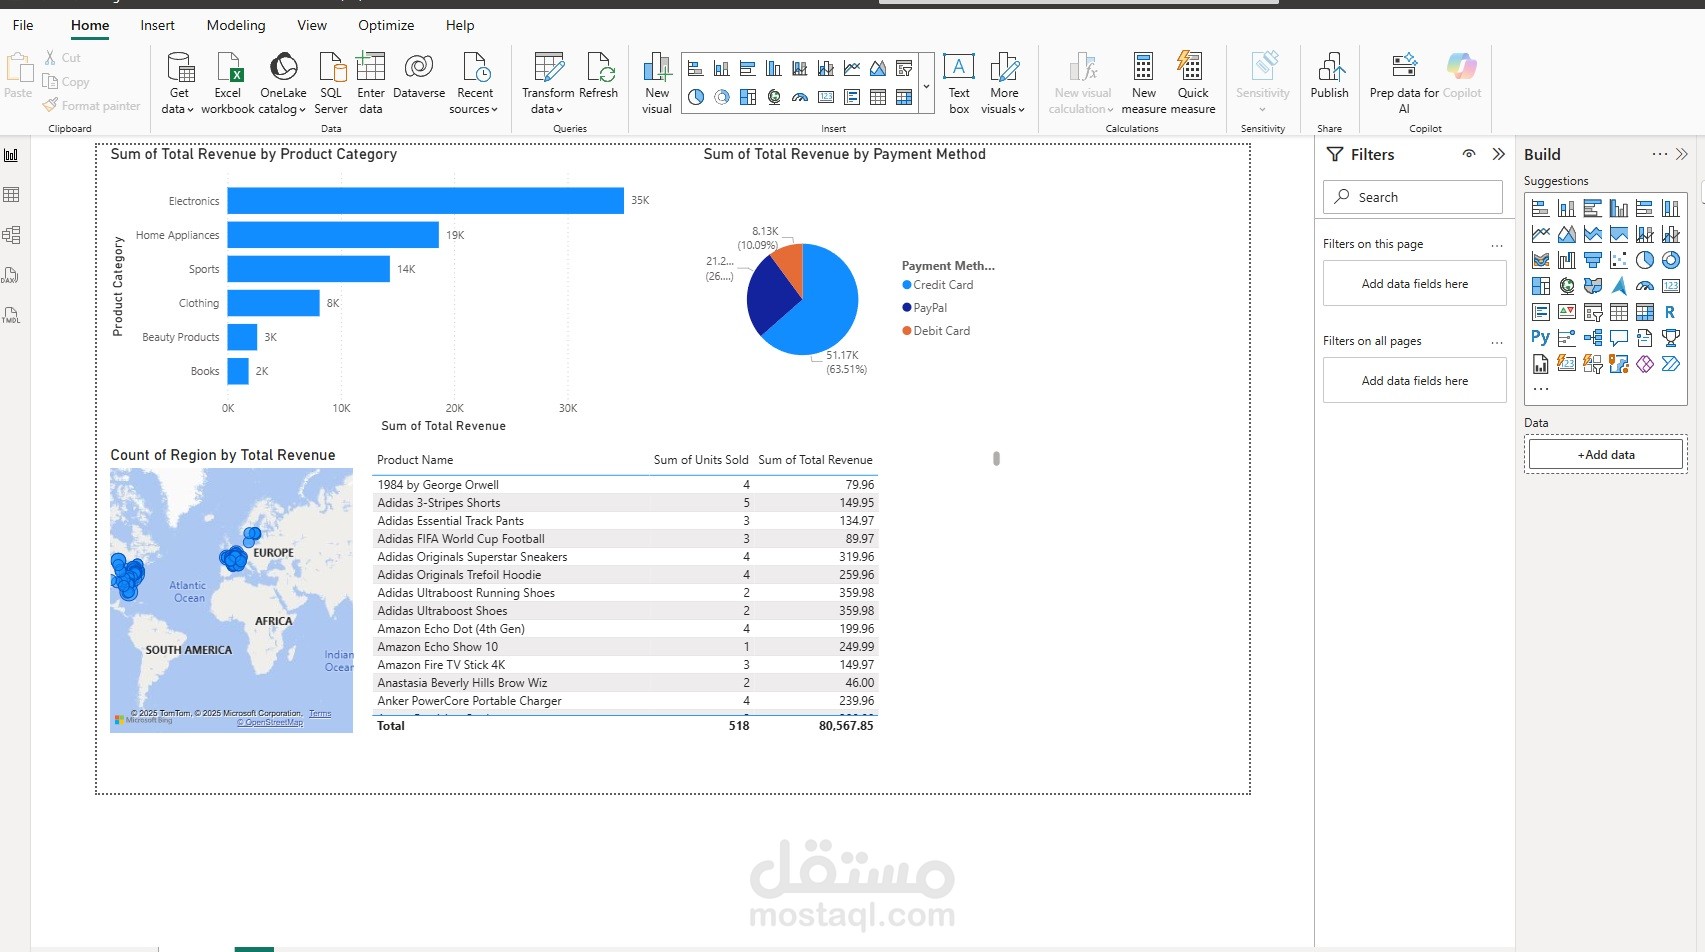
2. Simple Dashboard Requirements
After cleaning the data, load it into Power BI and create:
1. Column Chart – Revenue by Product Category
2. Map (Filled Map) – Revenue by Region
3. Pie Chart – Revenue by Payment Method
4. Table – Columns: Product Name, Units Sold, Total Revenue
---
3. Deliverables
.pbix file with cleaned data and visuals
Screenshot of Power Query applied steps
Screenshot of final dashboard