data_cleaned_Python
تفاصيل العمل
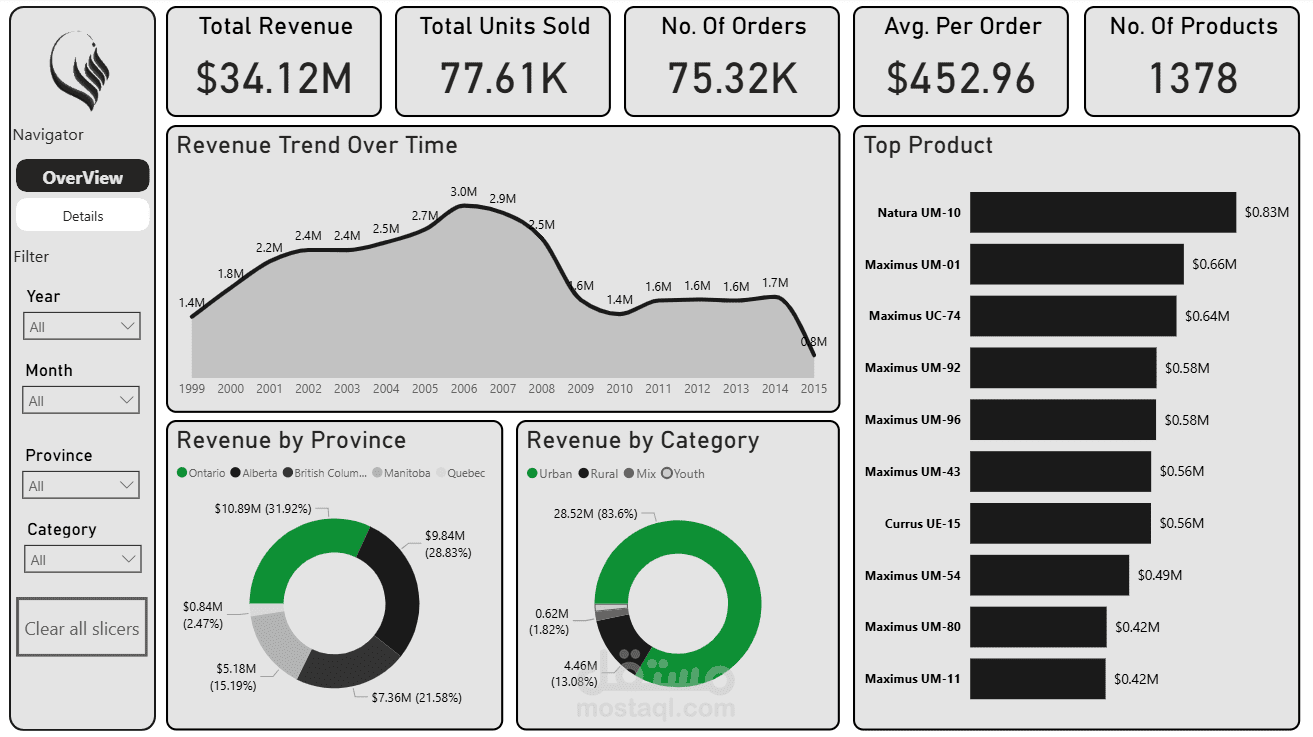
Revenue Performance Dashboard | Power BI
This interactive Power BI dashboard provides a detailed overview of company revenue performance across years, provinces, and product categories.
It was designed to monitor key business indicators and uncover insights into sales trends, customer segments, and regional performance.
Project Overview:
The dashboard analyzes revenue data from 1999 to 2015, focusing on total revenue, units sold, number of orders, and product performance.
Data was cleaned and transformed using Power Query, and custom measures were created in DAX to calculate total revenue, order averages, and profit metrics.
Key Insights:
Total Revenue: $34.12M | Units Sold: 77.61K | Orders: 75.32K
Average per Order: $452.96 | Total Products: 1,378
Top Product: Natura UM-10 with $0.83M in revenue.
Top Province: Alberta generating $10.89M (31.92%) of total revenue.
Urban category dominates sales, contributing 83.6% of total revenue.
Noticeable growth in revenue between 2000 and 2006 followed by a decline around 2009, indicating possible market or demand shifts.