Power BI Assignment: Retail Sales Data Cleaning & Simple Dashboard
تفاصيل العمل
وضح نوع العمل، ميزاته وطريقة تنفيذه.
صور وملفات العمل
اسحب الملفات إلى هنا
أو انقر للاختيار يدويا
أضف صور أو ملفات بحد أقصى 20 مرفق.
رابط المعاينة
(اختياري) رابط للعمل الذي قمت بتنفيذه مثال: رابط موقع، فيديو من YouTube أو Vimeo
تاريخ الإنجاز
المهارات
حدد المهارات والادوات التي استخدمتها لإنجاز العمل.
مهارات مقترحة
الكتابة الإبداعية
ووردبريس
باوربوينت
تصميم داخلي
تجسيد 3D
البحث على الإنترنت
تصميم مواقع
قوالب شوبيفاي
التعليق الصوتي
تصميم إعلان
فيراي
Adobe Illustrator
After Effects
تصميم بوسترات
تصميم فيديو
حفظ العمل
العمل 2 من 3
العمل 3 من 3
تأكيد الشروط
جميع الأعمال من تنفيذي ولدي الصلاحية لنشرها
*
التالي
Scenario:
You are a junior Data Analyst at a retail company. You’ve been given raw transaction data that needs basic cleaning in Power Query and then used to create a simple Power BI dashboard for management.
---
1. Data Cleaning in Power Query
Perform only the following steps:
1. Check & Correct Data Types
Transaction ID → Text
Date → Date
Units Sold → Whole Number
Unit Price & Total Revenue → Decimal Number (currency format applied after loading)
Region & Payment Method → Text
2. Rename Columns
Ensure clear and consistent names (e.g., ProductCategory → Product Category).
3. Fix Formatting Issues
Remove leading/trailing spaces in text fields.
Capitalize each word in Product Category and Region.
4. Handle Missing or Incorrect Data
Replace blank/null values with "Unknown" for text and 0 for numbers.
Remove duplicate rows.
5. Sort & Reorder Columns
Order: Transaction ID, Date, Product Category, Product Name, Units Sold, Unit Price, Total Revenue, Region, Payment Method.
---
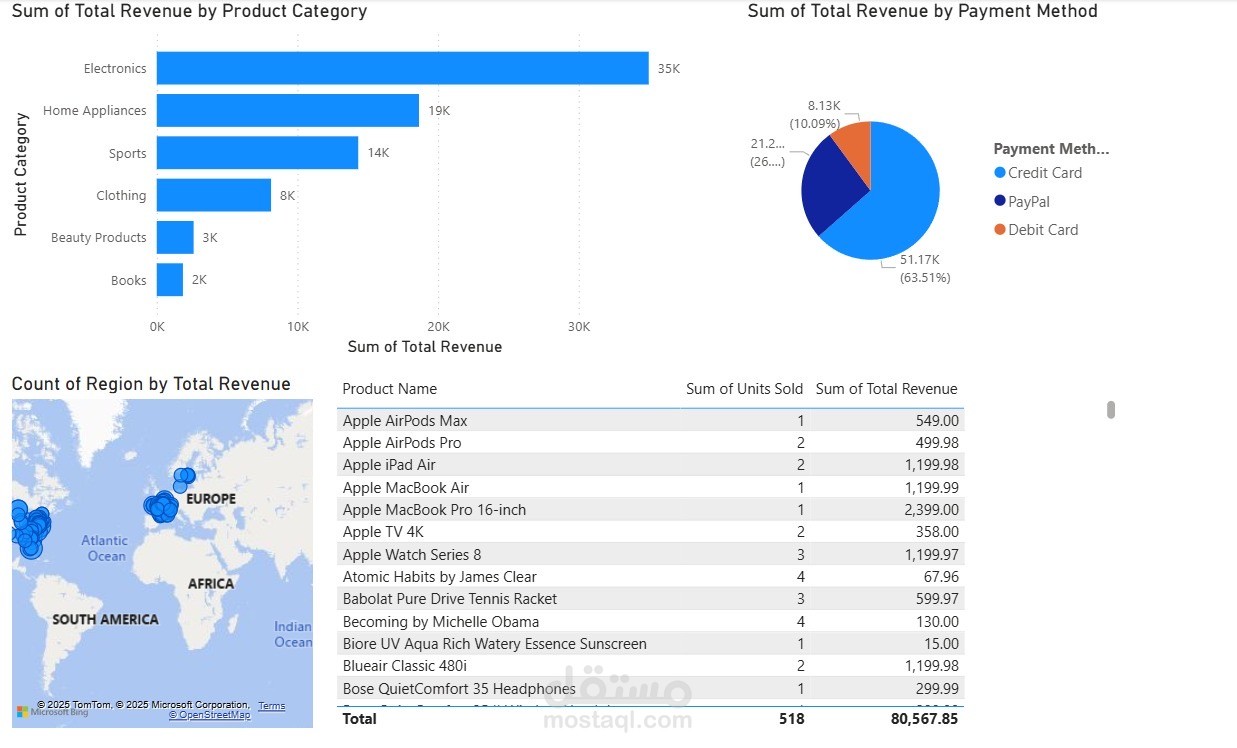
2. Simple Dashboard Requirements
After cleaning the data, load it into Power BI and create:
1. Column Chart – Revenue by Product Category
2. Map (Filled Map) – Revenue by Region
3. Pie Chart – Revenue by Payment Method
4. Table – Columns: Product Name, Units Sold, Total Revenue
---
3. Deliverables
.pbix file with cleaned data and visuals
Screenshot of Power Query applied steps
Screenshot of final dashboard