CEO Dashboard & Performance Analysis
تفاصيل العمل
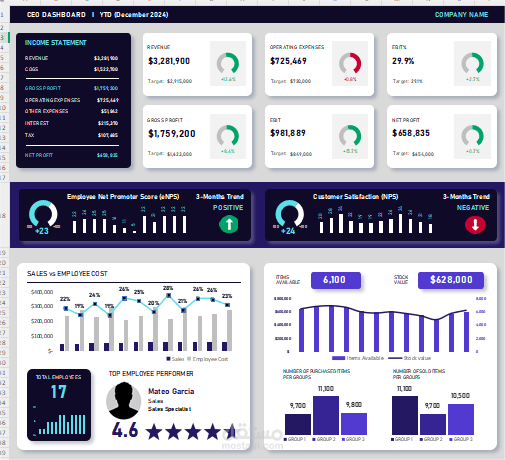
Project Description:
This project is an interactive CEO Dashboard developed using Excel and Power BI to monitor and analyze key financial and operational metrics. The dashboard provides a comprehensive view of the company’s performance, including:
Income Statement Analysis: Revenue, gross profit, operating expenses, EBIT, and net profit, with targets and performance indicators.
Employee Performance Metrics: Tracking employee efficiency, top performers, and employee costs.
Customer Metrics: Net Promoter Score (NPS) and Customer Satisfaction trends.
Sales & Inventory Insights: Visualization of sales performance, item availability, and stock value.
The dashboard allows management to make data-driven decisions quickly by visualizing complex datasets in a clear and interactive format.