sales in Egypt
تفاصيل العمل
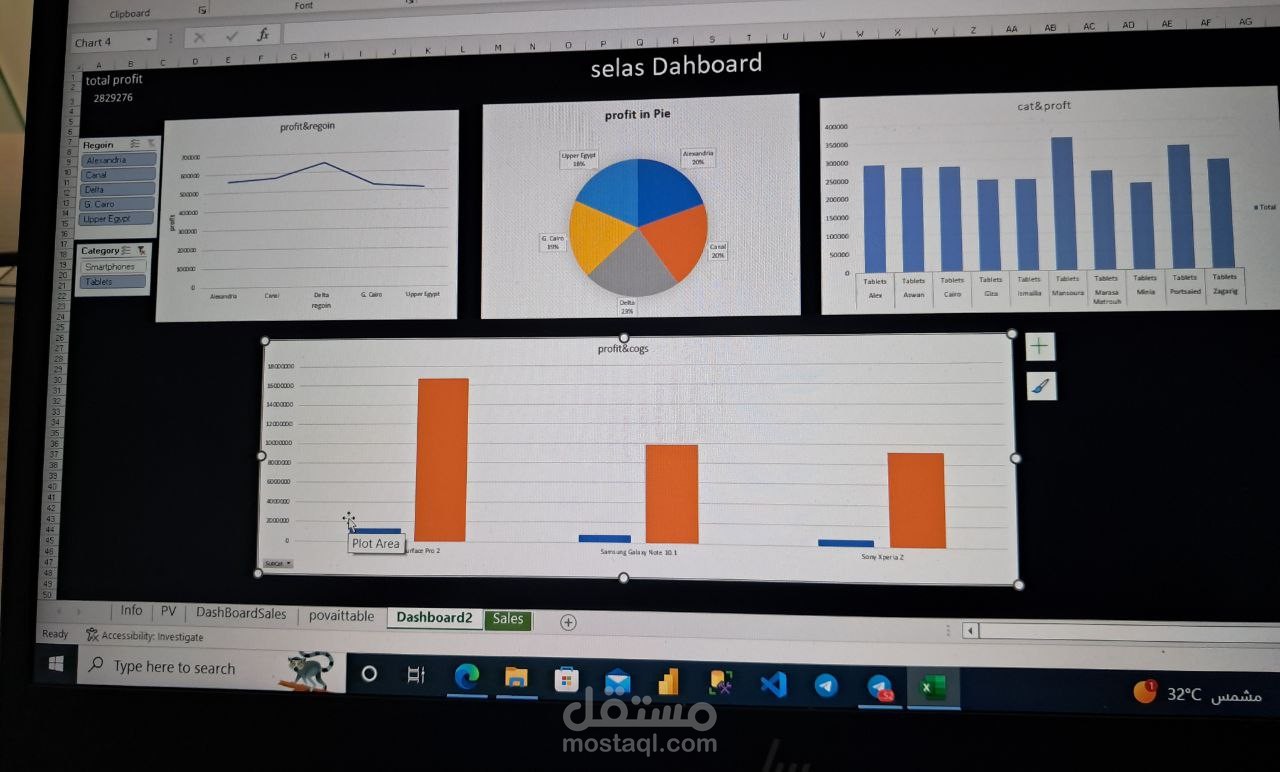
_The purpose of the first image is to present an interactive Excel dashboard for tracking and analyzing sales and profits.
It shows profits by region, category, city, and product.
The dashboard uses line charts, pie charts, and column charts to compare performance across different areas and categories.
It allows users to quickly filter data and make data-driven decisions.