pipeline project
تفاصيل العمل
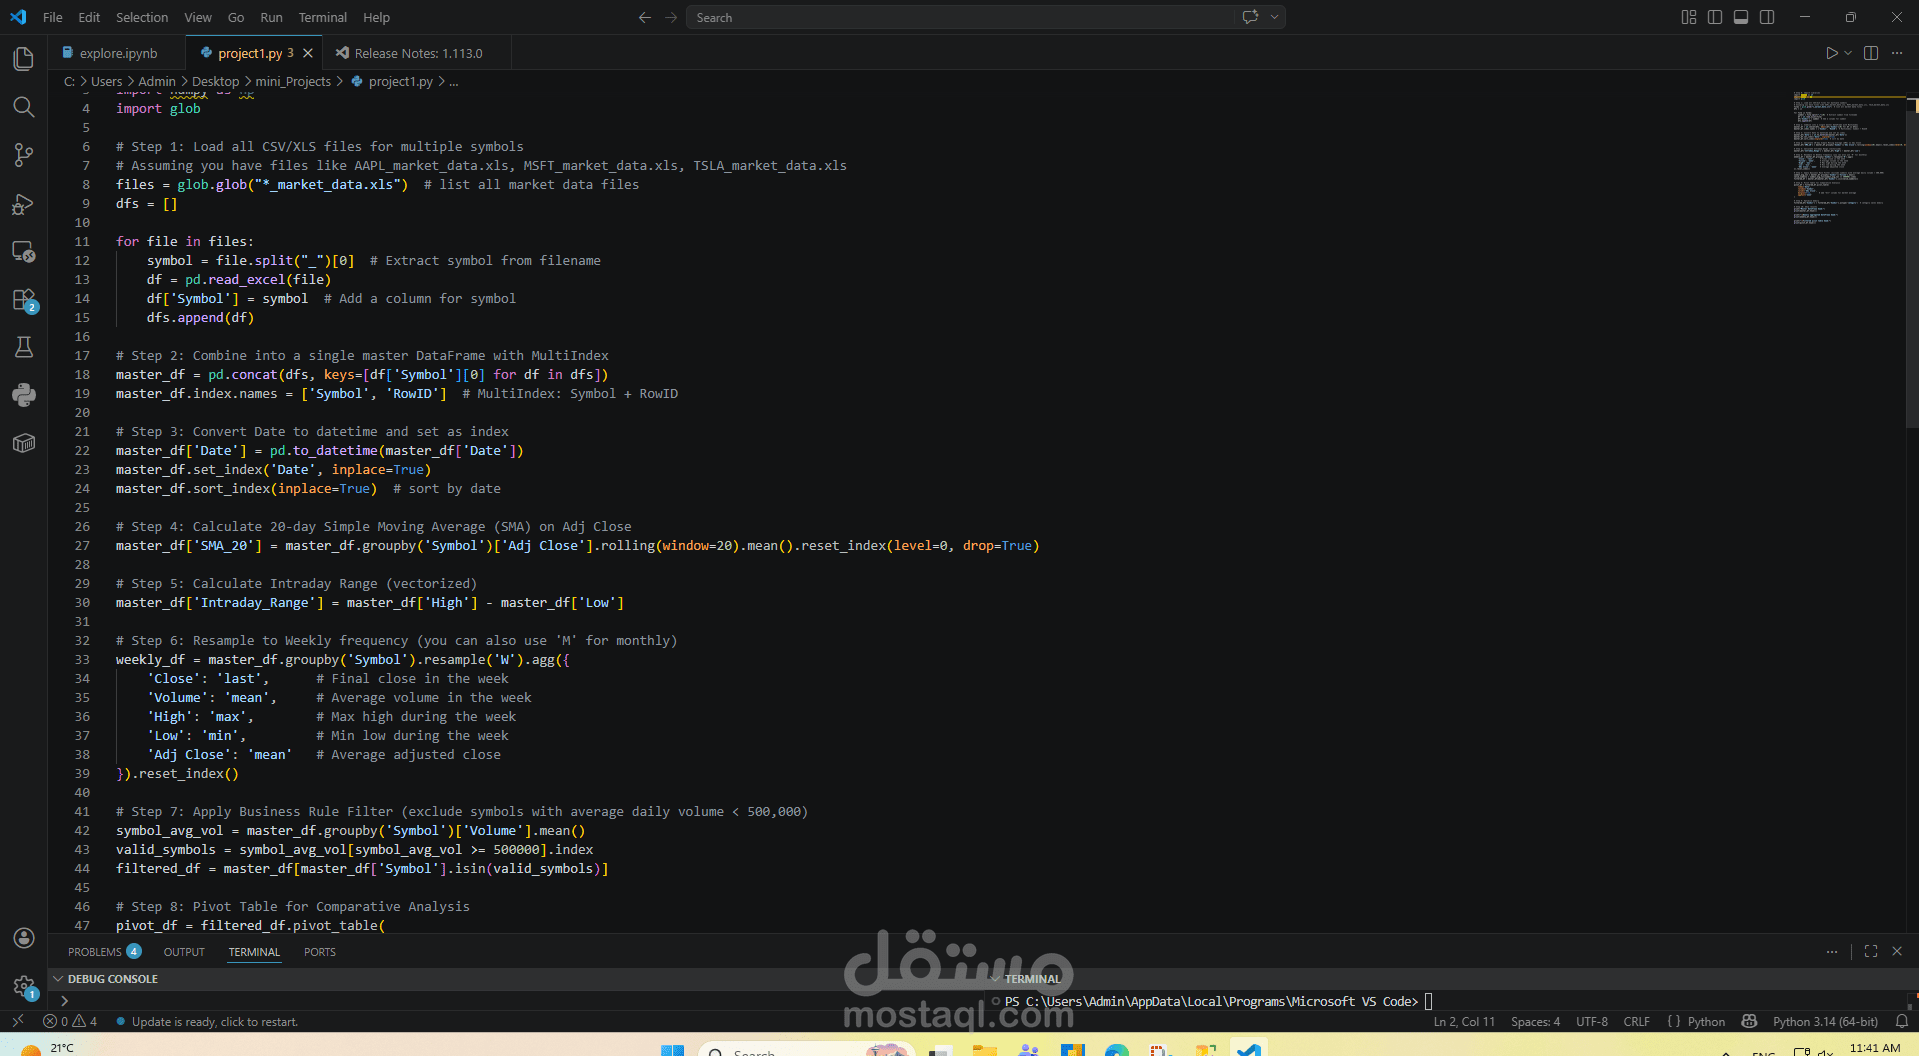
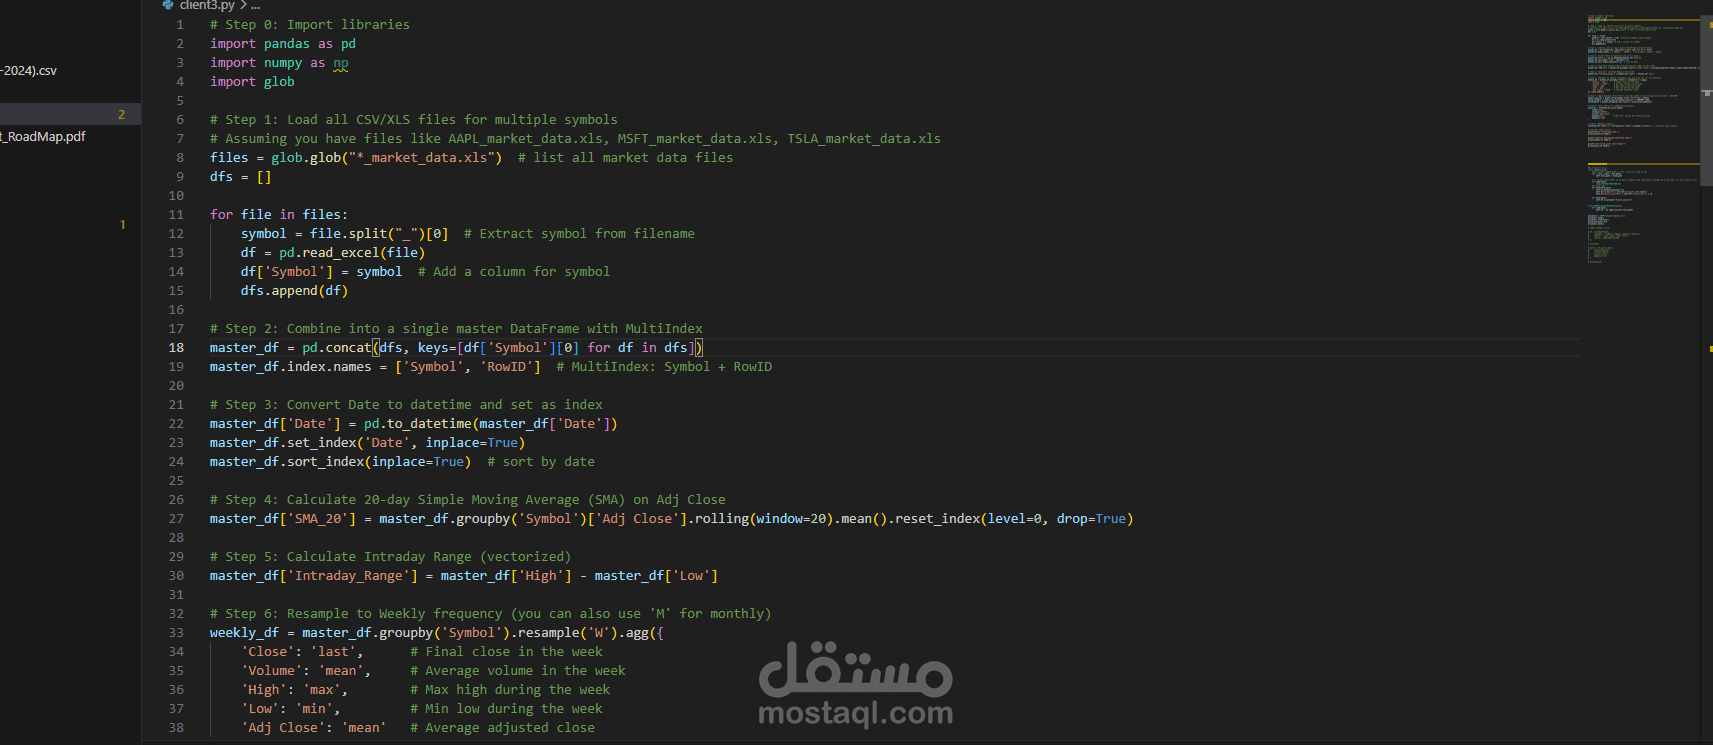
This project demonstrates a data processing workflow using Python and Pandas to analyze stock market data from multiple companies. The pipeline loads multiple Excel files, combines them into a unified dataset, and structures the data using a multi-index for efficient analysis.
The project includes several data transformation steps such as converting date formats, calculating financial metrics like the 20-day Simple Moving Average (SMA) and intraday price range, and resampling data to weekly frequency for aggregated analysis.
Business rules were applied to filter symbols based on trading volume, and a pivot table was created to enable comparative analysis of adjusted closing prices across different stocks. The workflow also includes memory optimization techniques to improve performance when handling larger datasets.