Sales Data Analysis
تفاصيل العمل
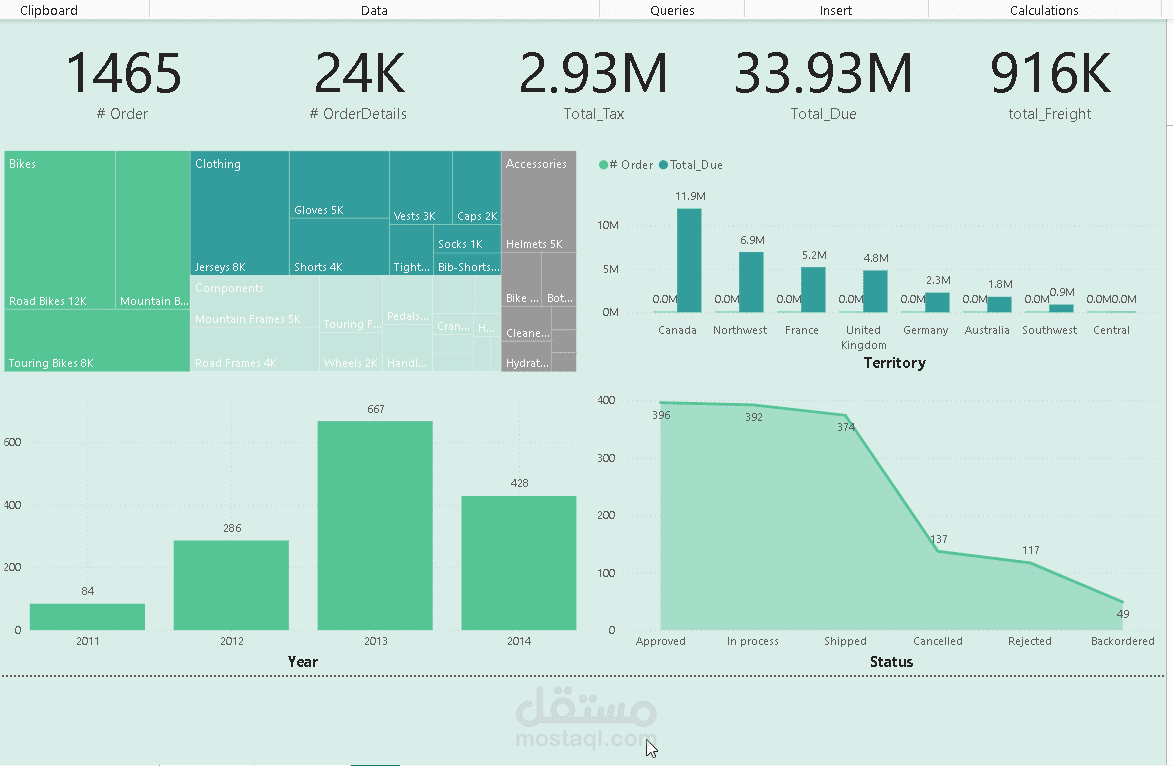
Analyzed a large sales dataset to uncover trends, patterns, and key performance metrics.
Key tasks included:
Using Python (Pandas, NumPy) for data cleaning, aggregation, and exploratory data analysis (EDA).
Creating visualizations with Matplotlib and Seaborn to identify seasonal trends and top-selling products.
Building an interactive Power BI dashboard to monitor sales performance across regions and time frames.
Calculating KPIs such as revenue growth, profit margin, and customer retention rate.
Value Added:
Provided actionable insights that supported strategic decision-making, optimized sales campaigns, and improved overall business performance.