Project 2: Retail Sales Performance – Tableau + SQL
تفاصيل العمل
Project 2: Retail Sales Performance – Tableau +
SQL
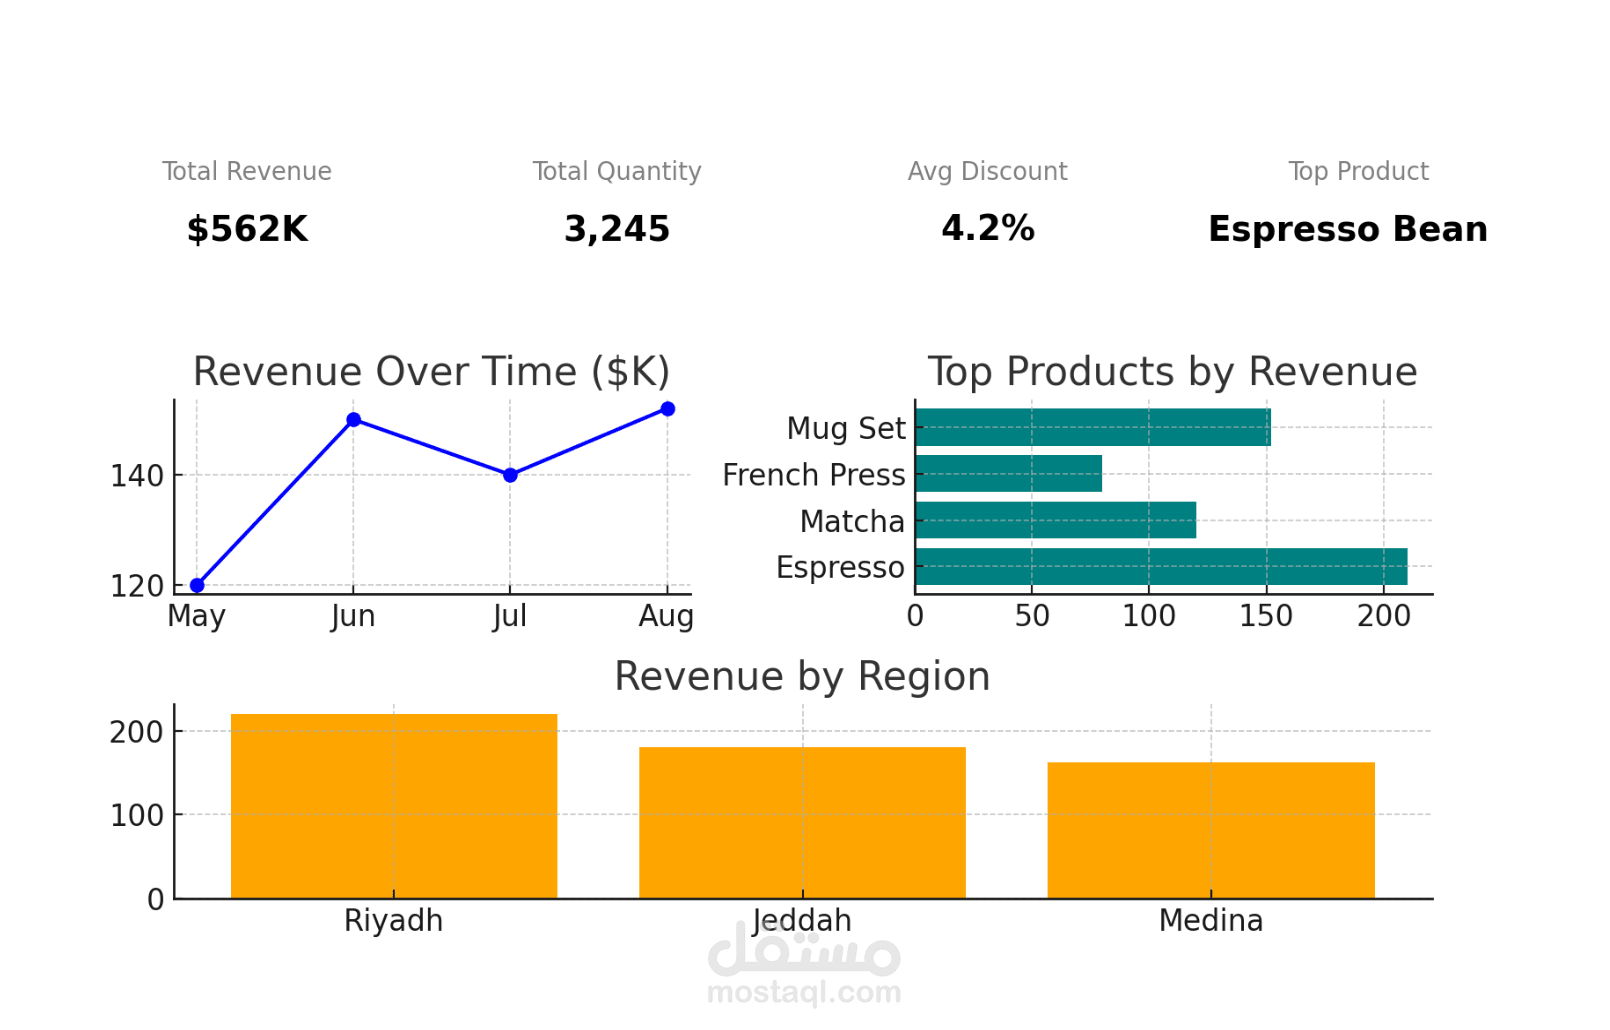
Description: A retail sales dashboard for coffee and accessories stores, showing revenue,
quantities sold, discounts, and performance by store, product, and category over time. The aim is to
provide store managers with insights on top products and regions, and analyze the impact of
discounts on revenue.
Tools & Technologies: Tableau Desktop (Visualization), SQL Database (any RDBMS for
backend, e.g., SQL Server/Postgres/MySQL)
Key Features: KPI Cards for total revenue, total quantity, and average discount. Line chart for
revenue over time. Bar chart for top products by revenue. Regional map or bar chart by store.
Parameter filters for date range, region, category, and discount range. Drilldown table with
order-level details.