Project 1: Enterprise Risk Dashboard – Power BI + Excel
تفاصيل العمل
Project 1: Enterprise Risk Dashboard – Power BI +
Excel
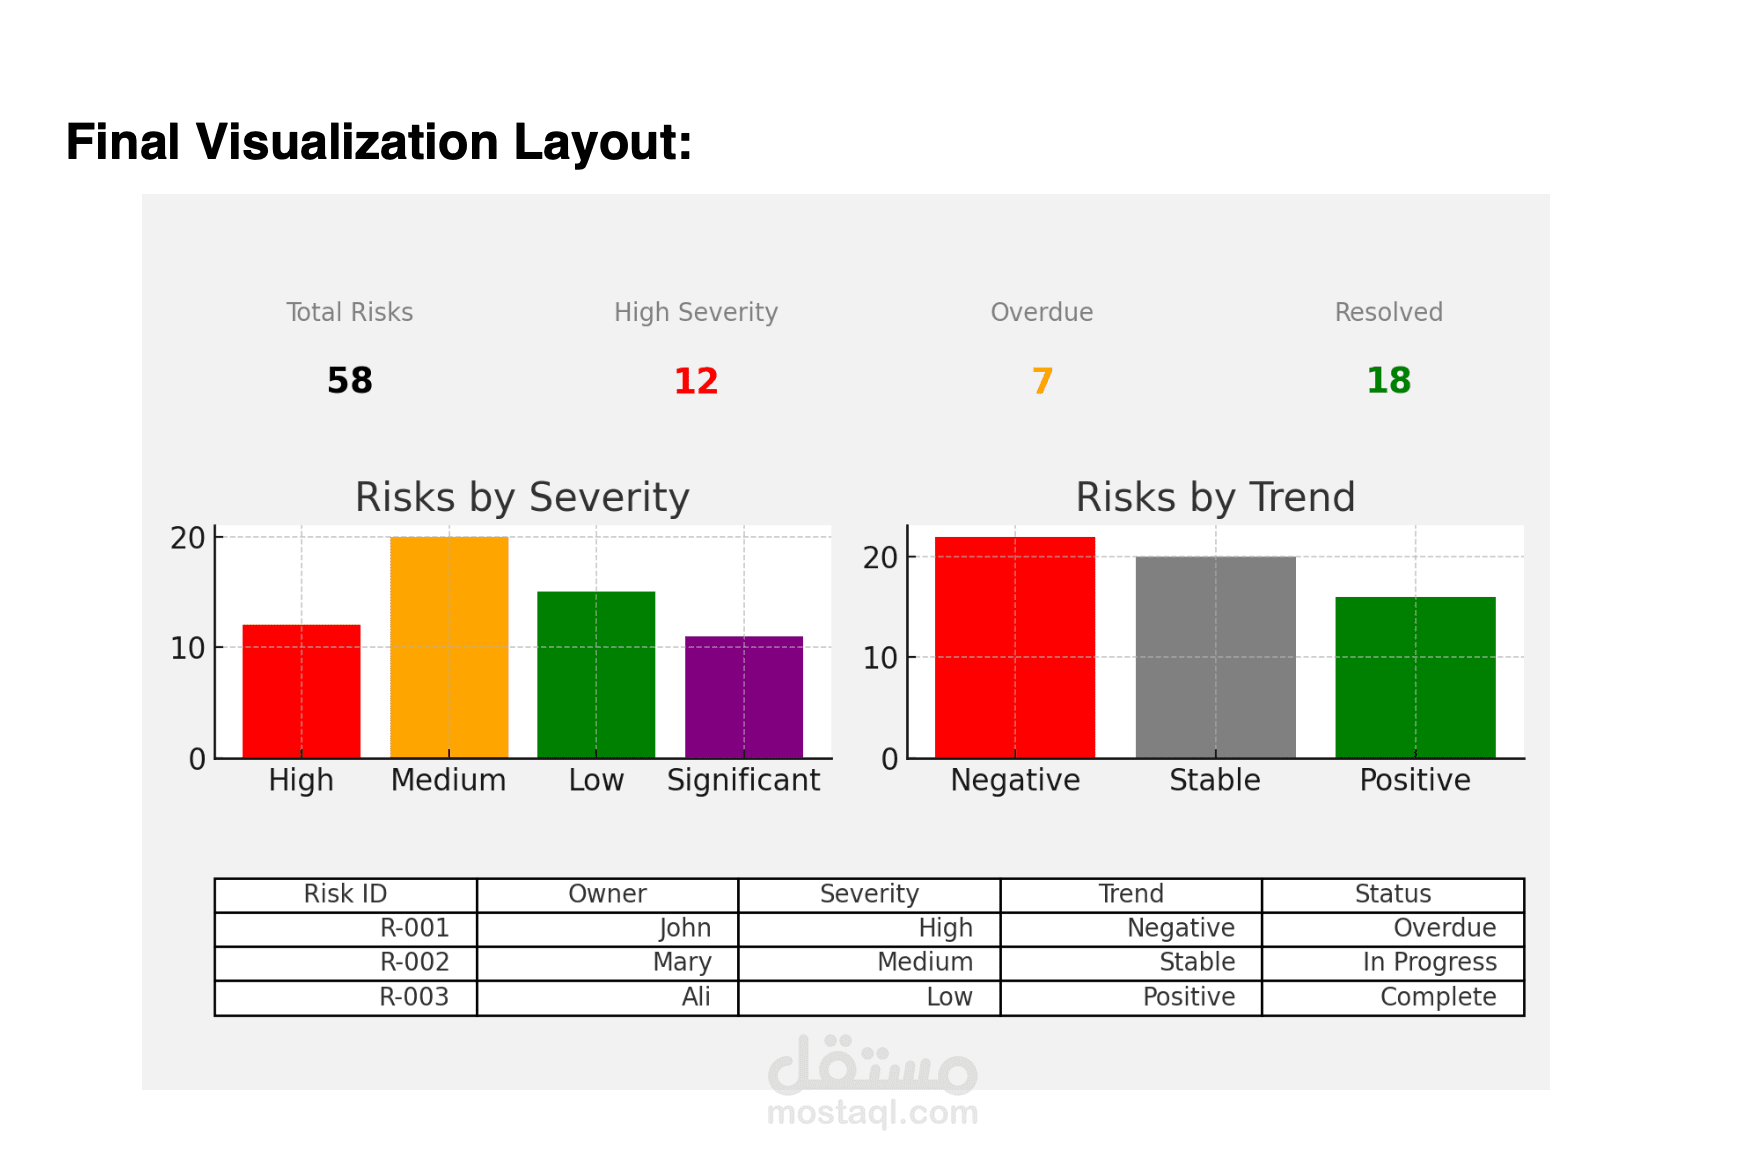
Description: An interactive Enterprise Risk Management dashboard designed to monitor risk
counts, severity levels (High/Medium/Low/Significant), trend direction (Positive/Stable/Negative),
and compliance with deadlines (Overdue/In Progress/Complete). The dashboard allows filtering by
risk owner, category, and status, with detailed tables for root causes and KPIs.
Tools & Technologies: Microsoft Power BI Desktop (Visualization), Microsoft Excel (Data source
& quick updates)
Key Features: KPI Cards for total risks, high severity, and trend counts. Stacked bar charts for risk
distribution by severity, trend, and owner. Slicers for filtering by status, category, and due date.
Table visual for detailed risk descriptions, causes, consequences, and KPIs.
