Activity insights
تفاصيل العمل
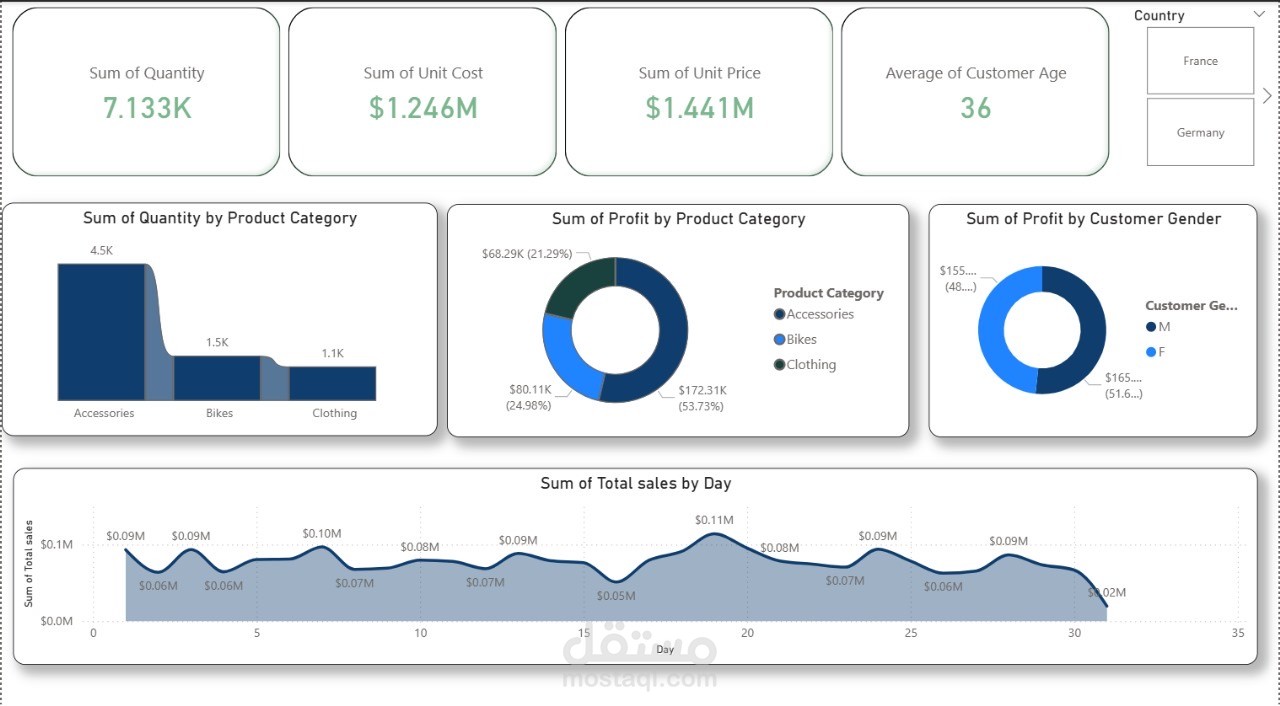
I designed and developed an interactive sales dashboard that provides clear business insights for a retail mall selling multiple product categories.
The dashboard highlights:
• Product category performance (high vs. low quantity and profit)
• Profit analysis by product category and customer gender
• Customer insights (average age, demographic segmentation)
• Sales trend analysis across different time periods
• Country-based filtering for deeper comparison
Key outcomes:
- Improved decision-making by visualizing sales and profit distribution
- Identified top-performing and underperforming categories
- Delivered actionable insights to optimize sales strategy
I specialize in building professional dashboards using Power BI & Excel, transforming raw data into meaningful insights that help businesses track performance, identify growth opportunities, and make data-driven decisions.