Employee Information Dashboard for Multi-Domain Organization
تفاصيل العمل

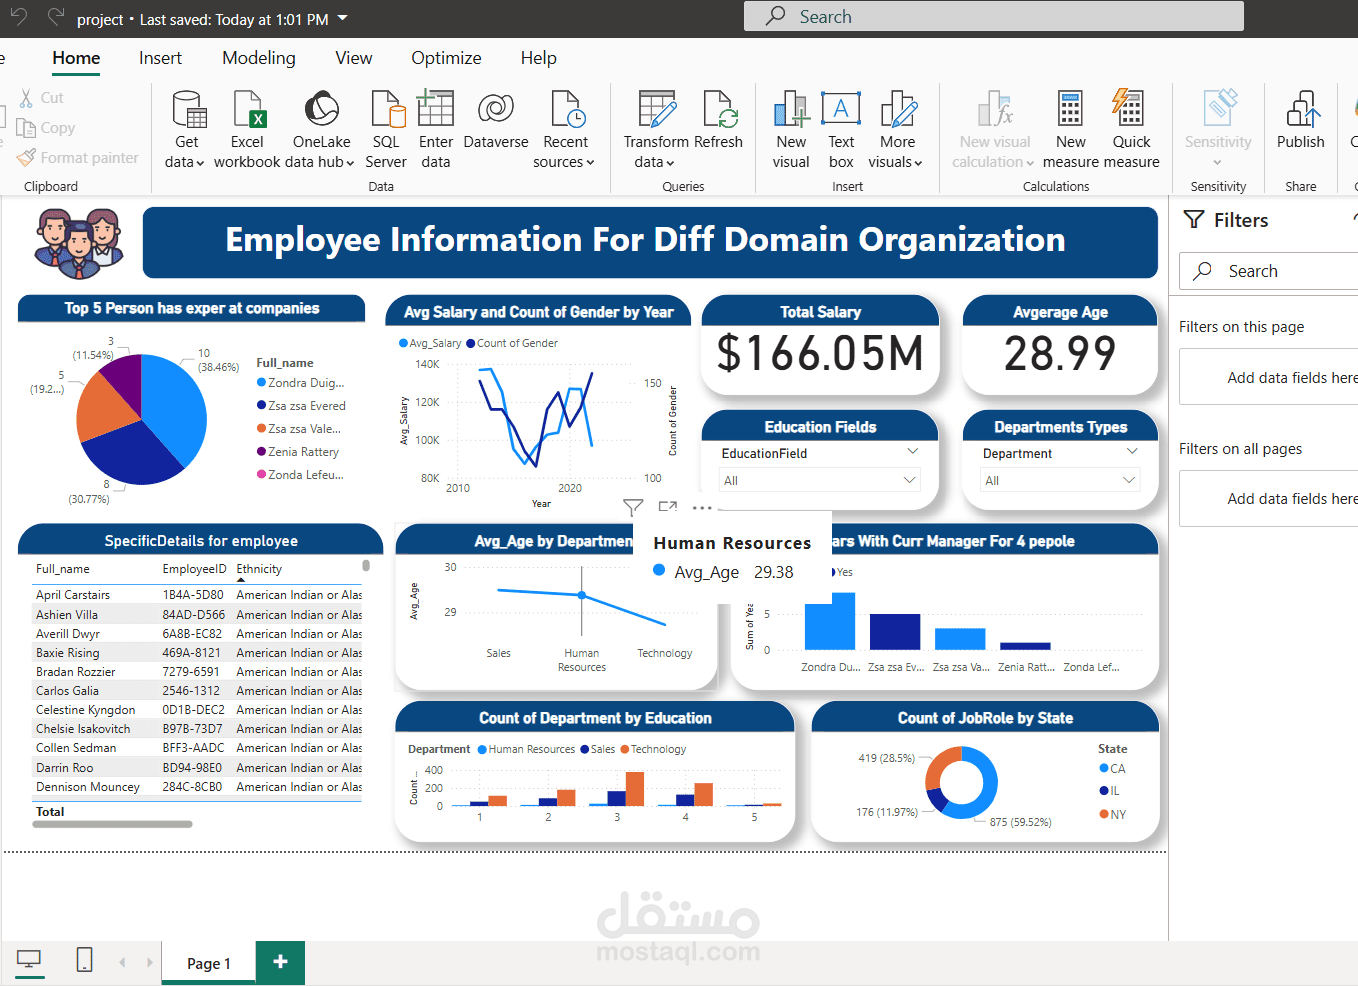
This Power BI dashboard presents a comprehensive analysis of employee data across different domains and departments. Key insights include:
Top 5 Employees with Broadest Company Experience – visualized via pie chart for quick comparison.
Salary Trends & Gender Distribution Over Time – with a dynamic line and combo chart.
Total Salary & Average Age – summarized with KPIs for quick snapshot.
Interactive Filters – for Education Fields and Department Types to allow tailored views.
Detailed Employee Info Table – showing full names, IDs, and ethnicities.
Average Age by Department – enabling HR-related demographic analysis.
Managerial Experience Insights – showing employees with long-term manager relationships.
Department & Education Correlation – visualized with bar charts.
Job Role Distribution by State – pie chart showing employee distribution across CA, IL, and NY.
Tools Used: Power BI | Data Modeling | DAX | Visualization
Focus: HR Analytics | Employee Demographics | Salary Analysis