Time-Series Visualization of Total Cost per Quarter
تفاصيل العمل
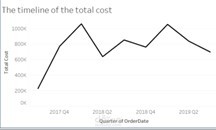
This project showcases a time-series line chart representing the total cost over several quarters, from Q4 2017 to Q2 2019.
The goal of the visualization is to highlight cost fluctuations and help identify spending patterns or anomalies over time.
This kind of analysis is essential for:
Budget forecasting
Financial trend analysis
Quarterly reporting for businesses
The chart was built using intuitive tools to ensure clarity and simplicity, with well-labeled axes and clean formatting for presentation.