Interactive Sales Dashboard with Geo Analysis and Product Category Breakdown
تفاصيل العمل
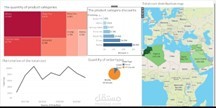
In this project, I developed an interactive sales dashboard that provides a clear and insightful overview of business performance.
Key components include:
Treemap showing product quantities by category
Horizontal bar chart for comparing product category revenues
Geo map to track order distribution across different countries
Line chart for sales performance over time
Pie chart displaying category shares or customer types
The dashboard is designed to support decision-making by combining geographic and category-level data analysis, useful for both marketing and operations teams.