Financial Performance Dashboard | Power BI
تفاصيل العمل
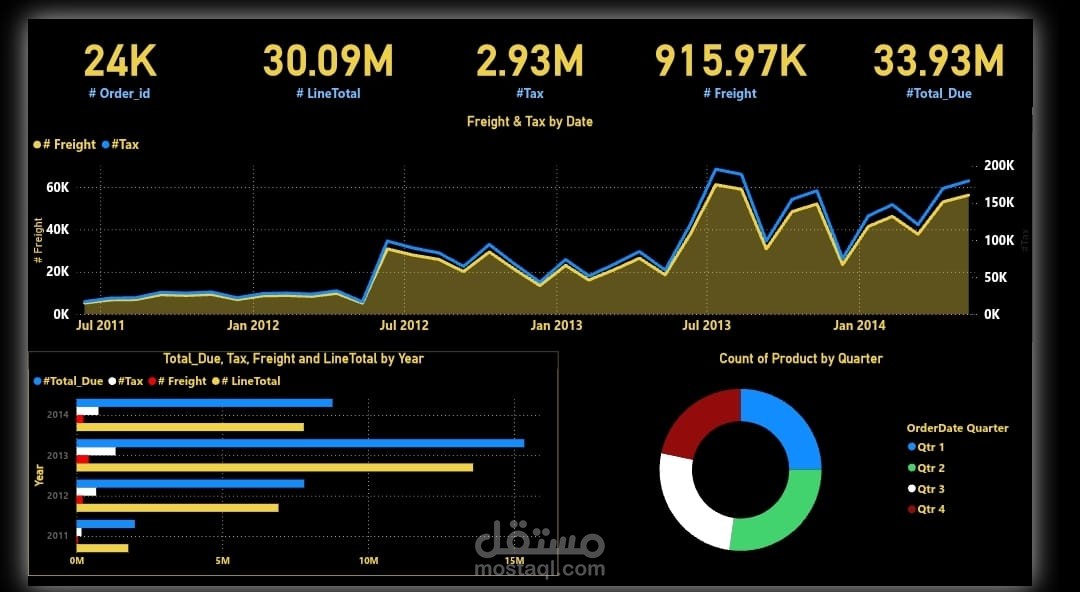

his project involved designing and developing an executive-level Power BI dashboard to analyze historical financial data across multiple years. The dashboard provides stakeholders with a comprehensive view of key financial indicators such as Total Due, Tax, Freight, and Line Total, segmented by year, quarter, and date.
The visual design follows a dark theme for a modern, high-contrast experience ideal for presentation settings and executive reporting.