netflix dashboard
تفاصيل العمل

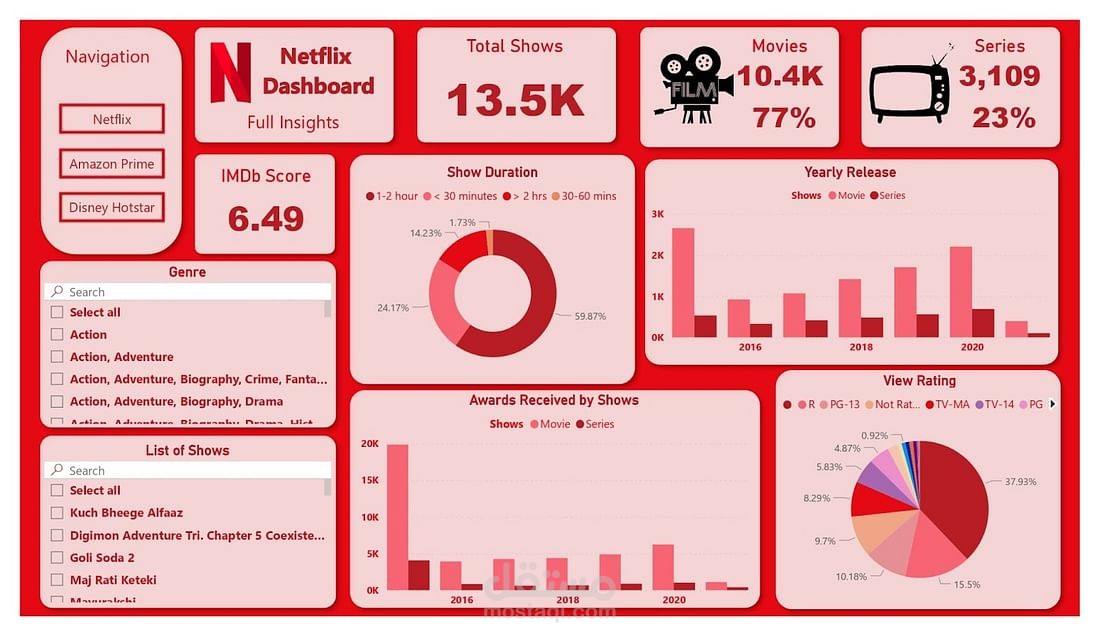
Netflix Content Dashboard — Full Insights at a Glance!
Excited to share my interactive Power BI dashboard that dives deep into Netflix content analytics. Here's what I uncovered from 13.5K titles:
Movies dominate with 77% of the content, while Series make up the remaining 23%.
⏱️ 60% of shows have a runtime between 1–2 hours, making them perfect for a one-sitting watch.
⭐ Average IMDb Score: 6.49
Visualized awards by year, with a clear rise in recognized content post-2018.
Filtered by genre, show names, ratings, and duration.
Tracked yearly release trends, content types, and view ratings (TV-MA, PG-13, etc.).
Tools used: Power BI | Excel | Data Cleaning | DAX
This dashboard empowers content strategists, marketers, and viewers with actionable insights.