Know my savings every month of the year
تفاصيل العمل
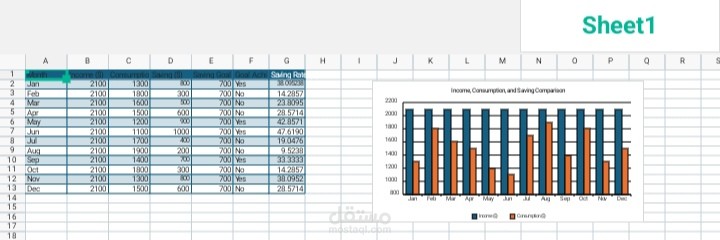
The table presents a monthly financial analysis for an individual or entity, covering the period from January to December. It includes key data such as:
Fixed monthly income: $2100
Monthly consumption: Varies by month
Savings: Calculated as the difference between income and consumption
Saving goal: A fixed amount of $700 per month
Goal achievement: Indicates whether the monthly saving goal was met
Saving rate: Calculated as a percentage of income
Saving Rate=) saving/income)*100
Purpose of the table:
To track whether the saving goal was achieved and analyze financial performance in terms of consumption and savings.
Observations:
The saving goal was achieved in only 5 out of 12 months.
The best saving performance was in June with a saving rate of 47.6%.
The lowest saving performance was in August with a saving rate of 9.5%.
The variation in saving rate highlights inconsistent financial behavior across the year.
Skills Demonstrated:
Financial data analysis
Use of spreadsheets to track performance metrics
Ability to interpret data and draw conclusions