Chocolate Factory Sales Analysis
تفاصيل العمل
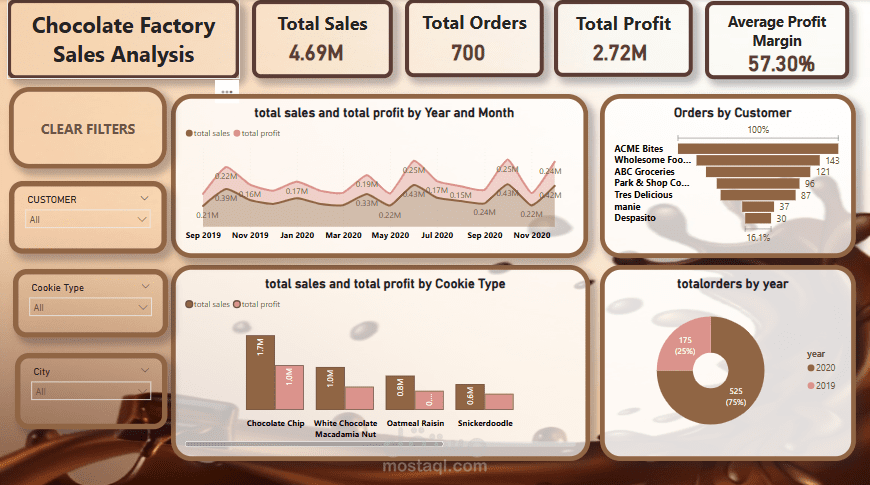
This Power BI dashboard provides a comprehensive sales analysis for a chocolate factory, focusing on sales performance, profit trends, and customer insights.
Key Features:
? Sales & Profit Tracking:
Total Sales, Orders, and Profit Overview for quick performance assessment.
Year-over-Year Analysis to identify growth and trends.
? Product & Customer Insights:
Sales Breakdown by Cookie Type to identify best-selling products.
Customer Order Distribution highlighting key clients.
? Geographical & Time-Based Trends:
Total Sales by City using an interactive map visualization.
Monthly & Yearly Sales Trends to track seasonal variations.
? Visual Appeal & Interactivity:
Filters for Customer, Cookie Type, and City for dynamic exploration.
Professional, Chocolate-Themed Design for a polished look.