Food Aids Beneficiaries
تفاصيل العمل
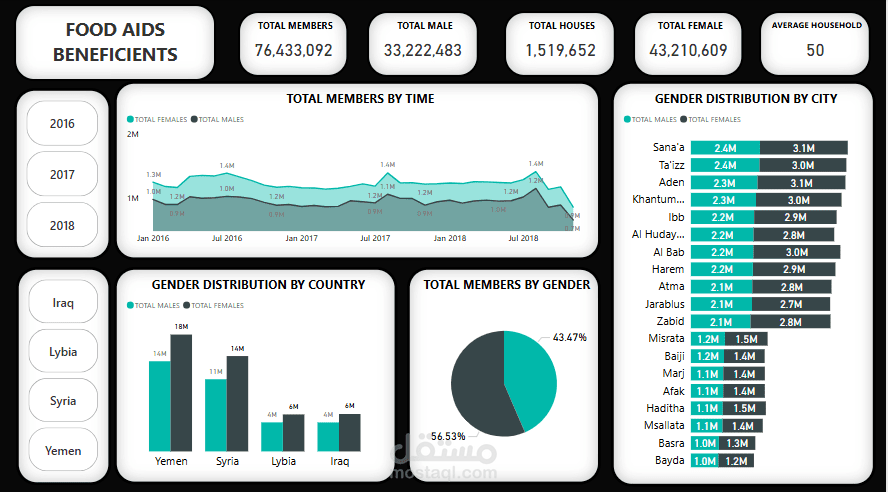
This Power BI project visualizes food aid beneficiaries across multiple dimensions, providing insights into demographics, housing conditions, and geographical distributions. The key aspects of the dashboard include:
Demographic Overview: Displays total members, gender distribution, and average household size.
Time-Based Analysis: Tracks changes in beneficiaries over time.
Geographical Breakdown: Shows gender distribution by country and city.
Housing Analysis: Categorizes beneficiaries by house type (tent, flat, room) and visualizes stable vs. temporary housing.
Top Cities by Beneficiaries: Highlights the cities with the highest number of aid recipients.
Interactivity: Users can filter by year and country for deeper analysis.
The project effectively organizes and presents data to support decision-making in humanitarian aid distribution.