Diabetes Dataset Insights - Power BI Dashboard
تفاصيل العمل
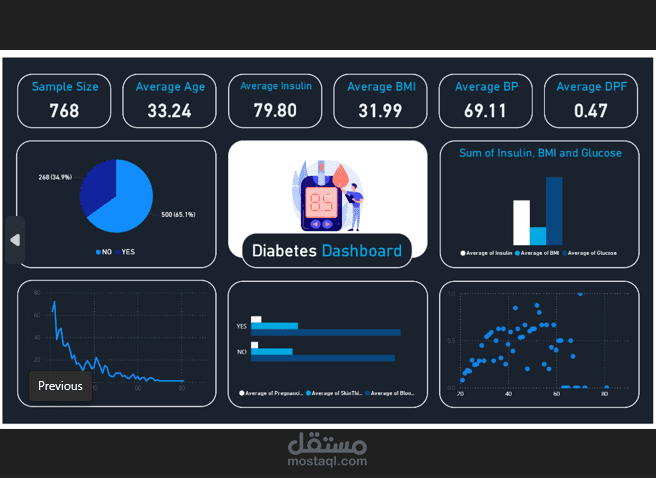
Power BI dashboard analyzing diabetes dataset to visualize key health metrics and trends for data-driven insights.
Overview:
This Power BI dashboard visualizes insights derived from the Pima Indians Diabetes dataset. The dataset contains various medical predictors and the target variable, Outcome, indicating whether a person has diabetes or not. The purpose of this dashboard is to explore key features influencing diabetes and provide a clear, interactive overview for further analysis.
Dataset Information:
The dataset includes data on female Pima Indian patients, at least 21 years old, with various health-related measurements. The dashboard primarily focuses on visualizing the relationships between these medical features and the diagnosis of diabetes.
Dataset Columns:
Pregnancies: Number of pregnancies.
Glucose: Plasma glucose concentration in an oral glucose tolerance test.
BloodPressure: Diastolic blood pressure (mm Hg).
SkinThickness: Triceps skin fold thickness (mm).
Insulin: 2-Hour serum insulin (mu U/ml).
BMI: Body mass index (weight in kg / (height in m)^2).
DiabetesPedigreeFunction: A function that represents the genetic risk of diabetes based on family history.
Age: The age of the patient.
Outcome: Target variable, where 1 represents diabetes-positive and 0 represents diabetes-negative.
How to Add or Modify Data
To update or add new data, go to Transform Data in Power BI Desktop.
Upload or edit the dataset in the Power Query Editor.
Re-load the data to refresh the dashboard visuals.
File Information:
File Type: Power BI (.pbix)
Source: The Pima Indians Diabetes dataset is publicly available on platforms such as Kaggle.
Future Enhancements:
Adding advanced predictive modeling visualizations (e.g., logistic regression or decision trees) to predict diabetes occurrence based on key features.
Introducing time-based trend analysis if extended data (e.g., follow-up records) becomes available.