تحليل البيانات باستخدام power Bi and excel
تفاصيل العمل
Data Analysis Project using Excel and Power BI
A data analysis project using Excel and Power BI involves collecting raw data, transforming it into a structured format, analyzing it to extract meaningful insights, and then visualizing these insights for better understanding and decision-making.
Project Phases:
Data Collection and Preparation (Excel):
Collection: Gathering data from various sources (databases, web, manual entry, etc.).
Cleaning: Identifying and correcting errors, inconsistencies, and missing values.
Transformation: Structuring the data, creating new columns, and ensuring data types are correct for analysis. Excel's powerful spreadsheet capabilities, functions, and even Power Query (built into Excel) are excellent for this phase.
Data Modeling and Analysis (Power BI and Excel):
Modeling: Building relationships between different data tables. In Power BI, you can create a robust data model that optimizes performance and allows for complex analysis.
Calculations & Measures: Using DAX (Data Analysis Expressions) in Power BI or advanced Excel formulas to create key performance indicators (KPIs) and other metrics.
Analysis: Applying various analytical techniques (e.g., trend analysis, comparative analysis, segmentation) to find patterns, anomalies, and insights within the data.
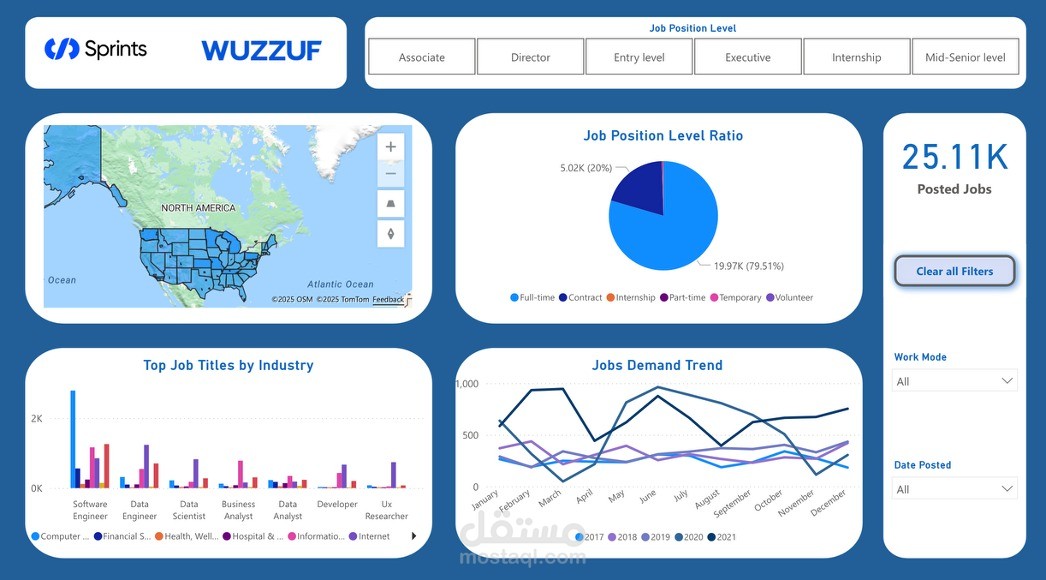
Data Visualization and Reporting (Power BI):
Dashboard Creation: Designing interactive dashboards and reports in Power BI using a variety of visuals (charts, graphs, tables, maps).
Storytelling: Presenting the insights in a clear, concise, and compelling manner to communicate the findings effectively to stakeholders. Power BI excels at creating dynamic and shareable reports.
Advantages of using Excel and Power BI for Data Analysis:
User-Friendly: Both tools have intuitive interfaces, making them accessible to a wide range of users, from beginners to advanced analysts.
Cost-Effective: Excel is widely available, and Power BI Desktop is free, making it a highly accessible solution for businesses of all sizes.
Powerful Data Handling: Excel can manage large datasets, and Power BI can handle even larger volumes of data and connect to numerous data sources.
Robust Analytical Capabilities: From basic calculations in Excel to complex DAX measures in Power BI, these tools offer extensive analytical power.
Interactive Visualizations: Power BI provides dynamic and interactive dashboards that allow users to drill down into data and explore insights.
Integration: Seamless integration between Excel and Power BI, allowing for data preparation in Excel and advanced visualization in Power BI.
Collaboration and Sharing: Power BI Service (cloud-based) enables easy sharing and collaboration on reports and dashboards across an organization.
Scalability: While Excel has limits, Power BI can scale to enterprise-level data analysis needs.
Impact on Decision-Making:
Data analysis, especially when effectively visualized, has a profound impact on decision-making:
Informed Decisions: Decisions are no longer based on gut feelings but on concrete, data-driven insights. This reduces uncertainty and risk.
Identifying Opportunities: By analyzing trends and patterns, businesses can identify new market opportunities, customer segments, or product improvements.
Problem Solving: Data analysis helps pinpoint the root causes of problems, allowing for more targeted and effective solutions.
Performance Monitoring: Dashboards provide real-time visibility into KPIs, enabling businesses to monitor performance, track progress towards goals, and react quickly to deviations.
Resource Optimization: Understanding data helps in allocating resources (financial, human, material) more efficiently to areas that yield the highest impact.
Predictive Capabilities: Advanced analysis can lead to predictive models, allowing businesses to forecast future trends and prepare proactively.
Increased Efficiency: Automating reporting and analysis processes frees up time for employees to focus on strategic initiatives rather than manual data compilation.
Competitive Advantage: Organizations that leverage data effectively can gain a significant competitive edge by making smarter, faster, and more agile decisions.
In essence, using Excel and Power BI transforms raw data into actionable intelligence, empowering individuals and organizations to make strategic decisions that drive growth and efficiency.