Data analysis using power bi
تفاصيل العمل
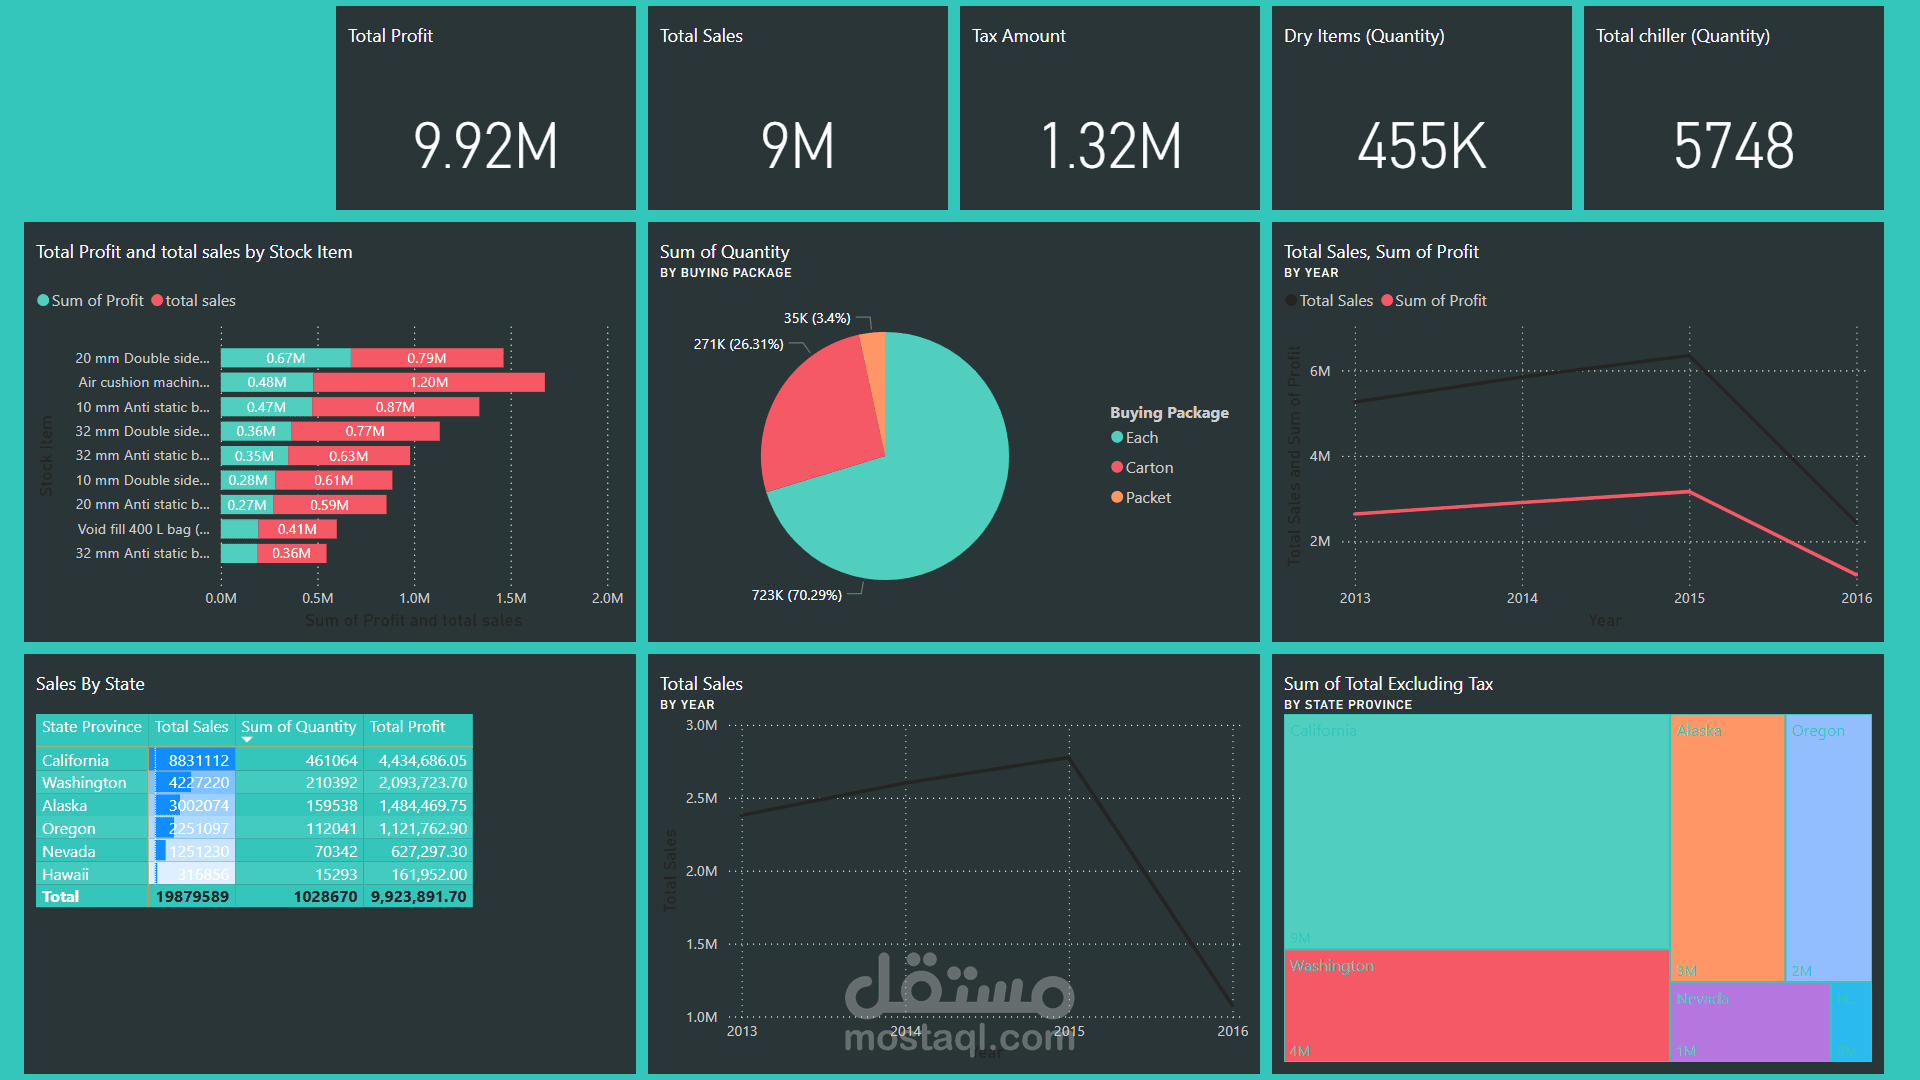
This interactive Power BI dashboard provides a comprehensive analysis of sales and profitability across different states and product categories. It highlights key metrics such as total profit, total sales, tax amounts, and quantity breakdowns by packaging type. The dashboard also includes visualizations that compare sales and profit trends over time, along with insights into regional performance. This data-driven approach helps identify areas of high profitability and opportunities for growth