درجة حرارة الارض|LST
تفاصيل العمل
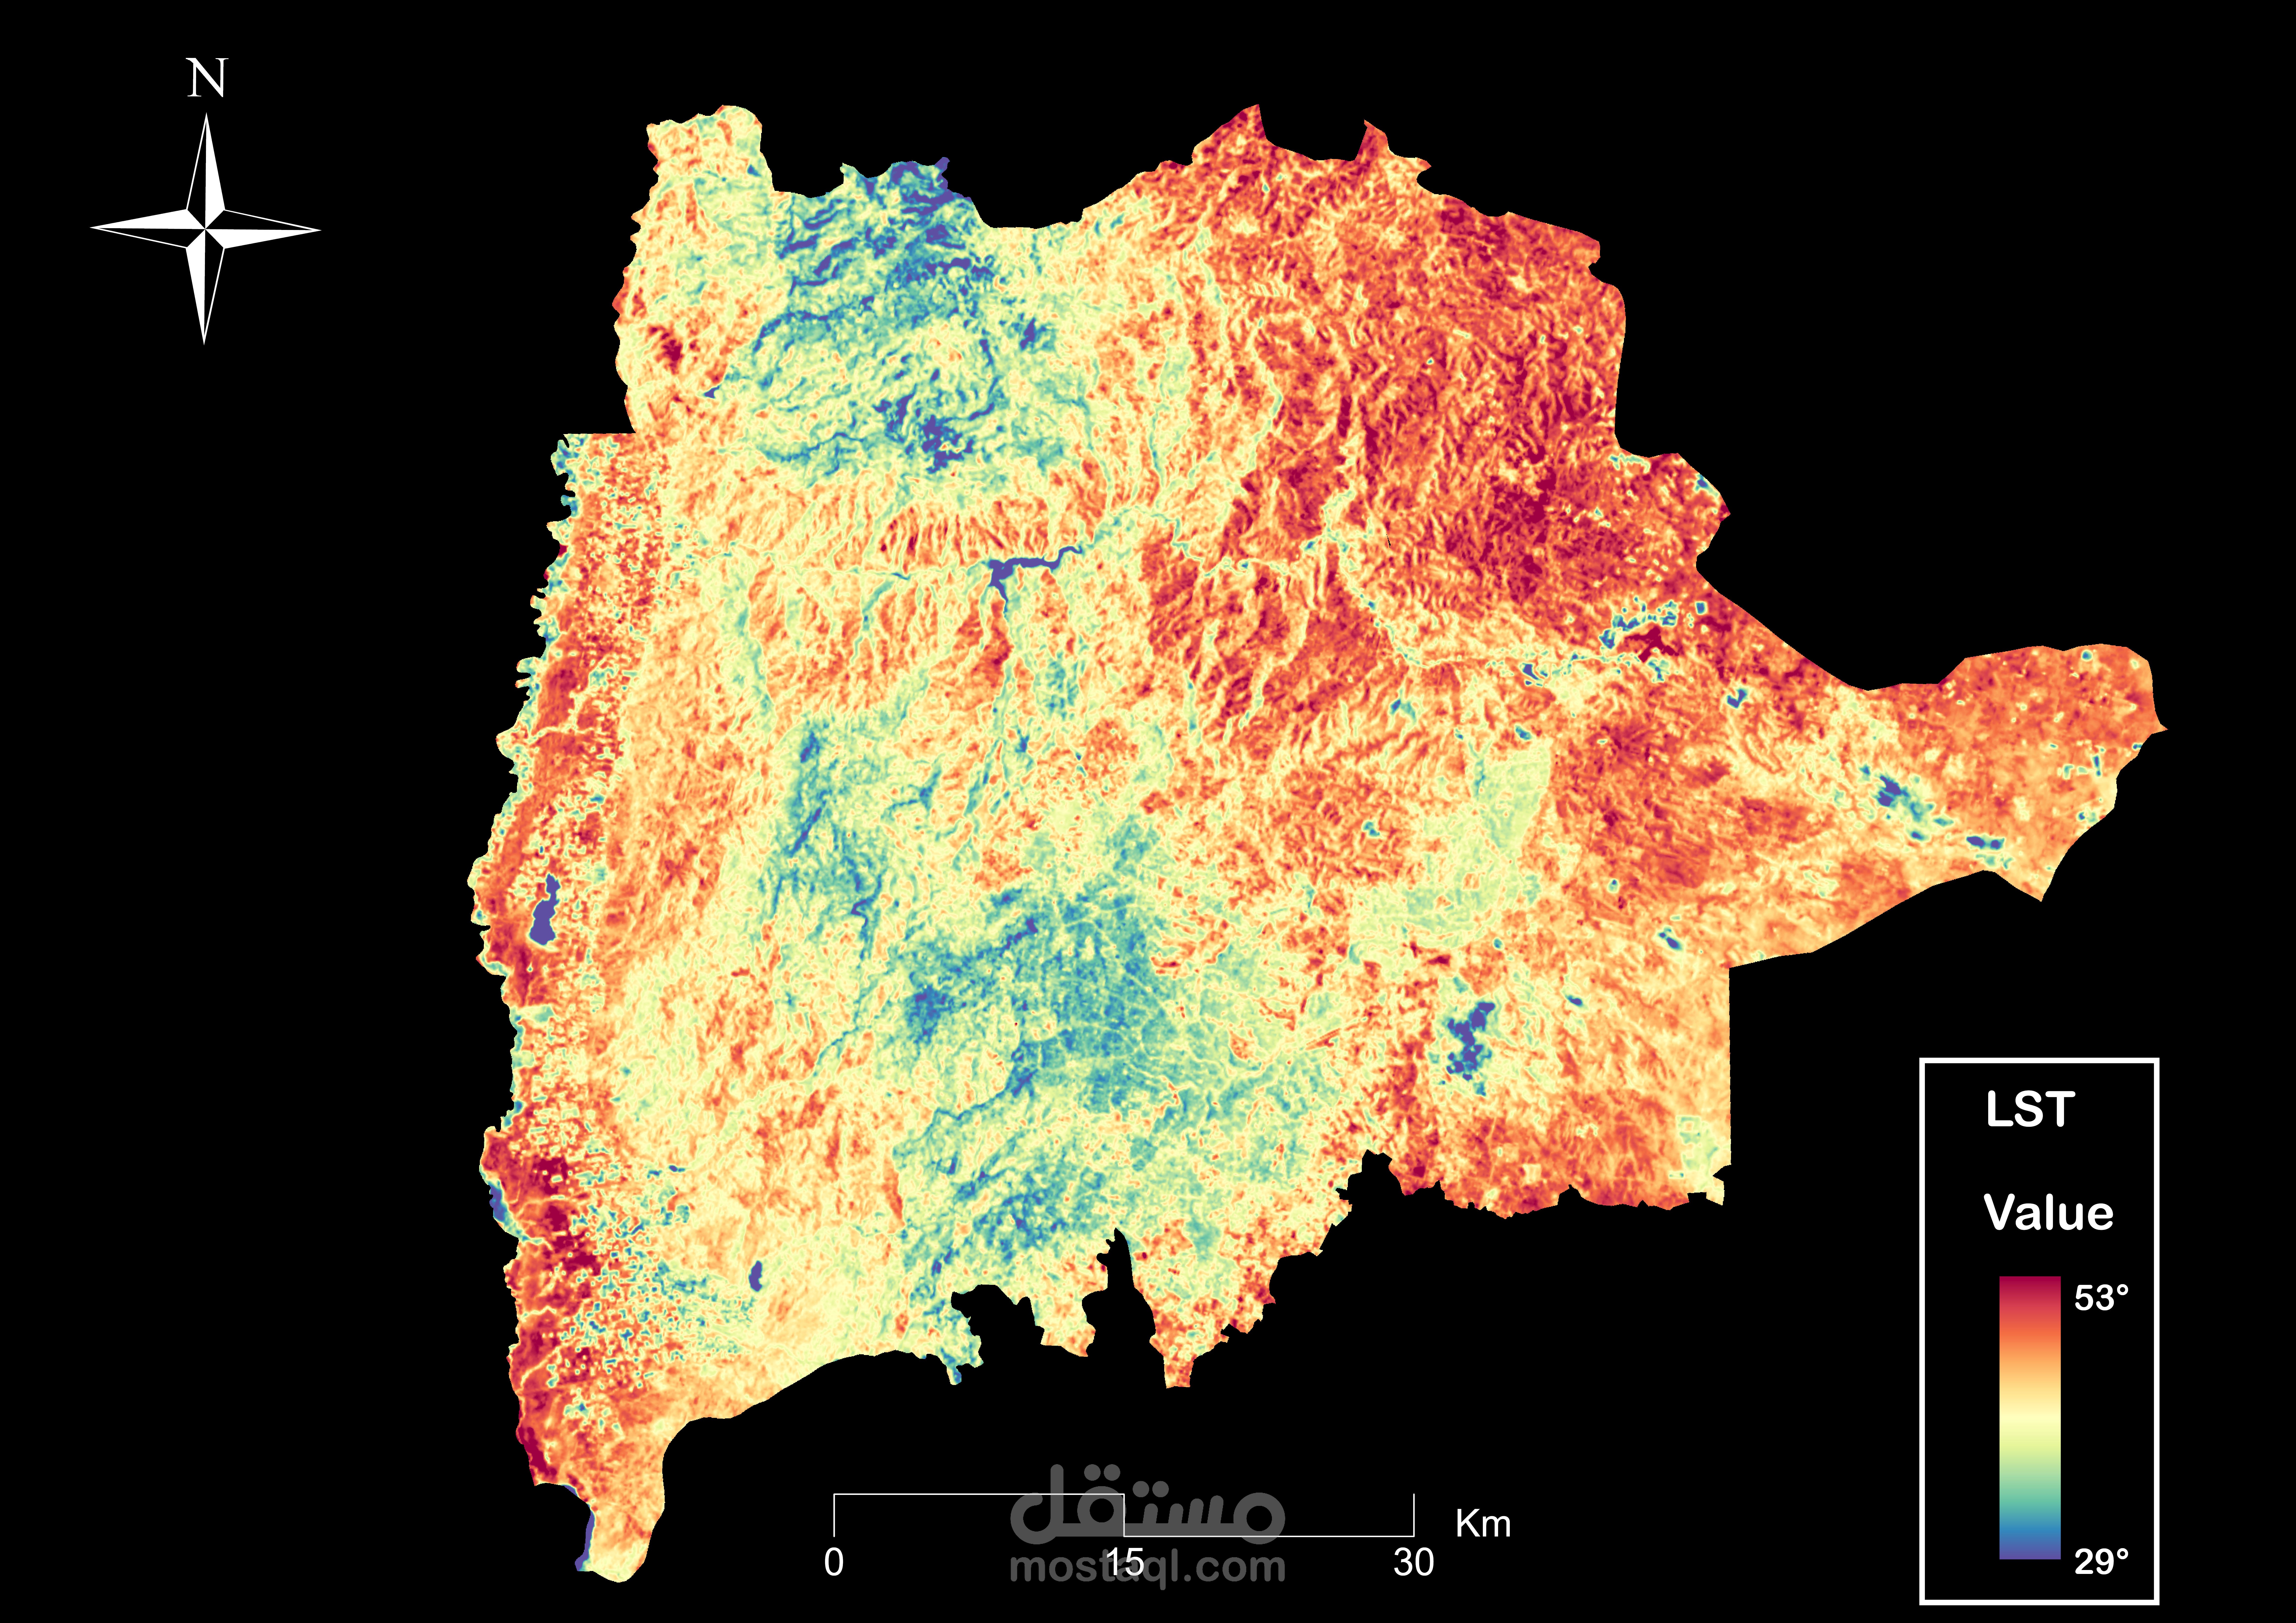
الصورة تُظهر خريطة لدرجات حرارة سطح الأرض (Land Surface Temperature - LST) لإقليم شمال الأردن، والتي تم إنتاجها من خلال تحليل بيانات حرارية ملتقطة بواسطة الأقمار الصناعية (مثل Landsat 8 أو 9). يعتمد هذا التحليل على حساب الإشعاع الحراري المنبعث من سطح الأرض لتحليل التباين المكاني لدرجات الحرارة.
نطاق درجات الحرارة الظاهرة: من 29° مئوية (اللون الأزرق) إلى 53° مئوية (اللون الأحمر)، كما هو موضح في مفتاح الخريطة.
المناطق الزرقاء: تشير إلى مناطق ذات درجات حرارة منخفضة نسبيًا، مثل الأراضي الزراعية أو الغابات أو المناطق المائية.
المناطق الحمراء: تمثل المناطق الأكثر سخونة، والتي غالبًا ما تكون حضرية أو مكشوفة وتعاني من ندرة الغطاء النباتي.
الاستخدام العملي: يُستخدم هذا التحليل لرصد ظاهرة الجزر الحرارية الحضرية (Urban Heat Islands)، وتقييم العلاقة بين توزيع الحرارة والغطاء الأرضي، مما يدعم عمليات التخطيط العمراني المستدام، وإدارة الموارد الطبيعية.
تم إعداد التحليل باستخدام برنامج ArcGIS Pro، وتم حساب LST باستخدام الباند الحراري والاعتبارات الإشعاعية والانبعاثية حسب المعايير العلمية المعتمدة.
The image shows a Land Surface Temperature (LST) map for the northern region of Jordan, produced by analyzing thermal data captured by satellites (such as Landsat 8 or 9). This analysis relies on calculating the thermal radiation emitted from the land surface to analyze the spatial variation of temperatures.
The apparent temperature range is from 29°C (blue) to 53°C (red), as shown in the map legend.
Blue areas indicate areas with relatively low temperatures, such as agricultural lands, forests, or water bodies.
Red areas represent hotter areas, often urban or exposed and suffering from scarce vegetation cover.
Practical Use: This analysis is used to monitor the urban heat island phenomenon and assess the relationship between heat distribution and land cover, which supports sustainable urban planning and natural resource management.
The analysis was prepared using ArcGIS Pro, and LST was calculated using the thermal band and radiative and emissivity considerations according to established scientific standards.

