Grocery Data Analysis
تفاصيل العمل
## Project Overview
This project involves data analysis and visualization using the R programming language. The script provided performs two main tasks:
1. **K-Means Clustering**: The script performs k-means clustering on the provided dataset based on user input. It groups data by `age` and `total spending` and generates clustering results.
2. **Association Rule Mining**: The script reads transactional data and generates association rules using the `apriori` algorithm based on user-defined support and confidence levels.
3. **Data Visualization**: The script visualizes the dataset using various plots including pie charts, bar plots, and box plots.
## Prerequisites
Ensure you have the following R libraries installed:
- `arules`
- `dplyr`
You can install these packages using the following commands:
```R
install.packages("arules")
install.packages("dplyr")
```
## Usage Instructions
1. **Reading the Dataset**:
The script will prompt you to enter the path of your CSV file containing the dataset. Ensure your CSV file includes columns such as `age`, `total`, `customer`, `paymentType`, and `city`.
2. **K-Means Clustering**:
- The script will ask you to enter the number of clusters (between 2 and 4).
- The script will perform clustering twice:
- First, it groups data by `age` and sums the `total` spending.
- Second, it directly uses the `age` and `total` columns for clustering.
- The clustering results will be printed.
3. **Association Rule Mining**:
- The script will prompt you to enter the path of your transactional data file.
- Enter the minimum support and confidence levels (between 0.001 and 1).
- The script will generate and display the association rules.
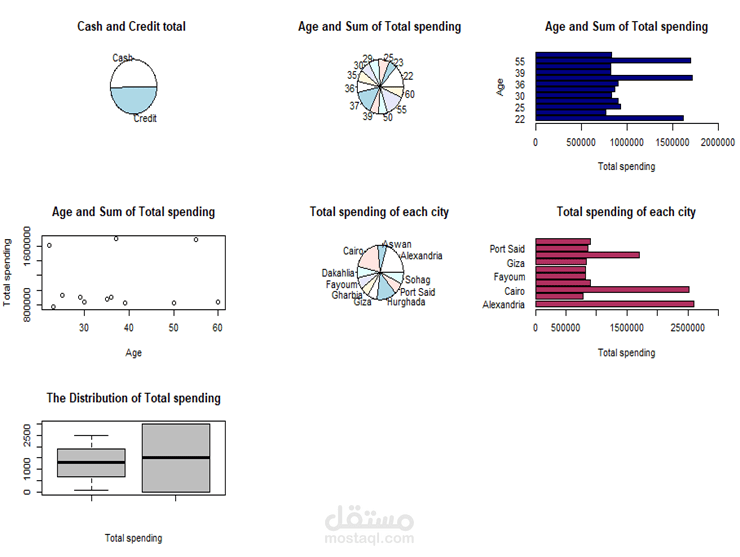
4. **Data Visualization**:
The script generates the following visualizations:
- Pie chart of payment types.
- Pie chart and bar plot of age and total spending.
- Scatter plot of age and total spending.
- Pie chart and bar plot of total spending per city.
- Box plot of the distribution of total spending.
## Example Workflow
1. **Run the Script**:
```R
source('your_script_name.R')
```
2. **Enter the Path to Your Dataset**:
```
Enter your file: /path/to/your/dataset.csv
```
3. **Enter the Number of Clusters**:
```
Please enter a number between 2 & 4
Enter your number of clusters: 3
```
4. **Enter the Path to Your Transactional Data**:
```
Enter your file: /path/to/your/transactions.csv
```
5. **Enter Support and Confidence Levels**:
```
Enter the support: 0.01
Enter the confidence: 0.8
```
## Output
The script will output the following to the console:
- Clustering results and tables.
- Generated association rules.
The script will also generate and display the following plots:
- Pie chart for payment types.
- Pie chart, bar plot, and scatter plot for age and total spending.
- Pie chart and bar plot for total spending per city.
- Box plot for the distribution of total spending.