Diabetes Prediction
تفاصيل العمل
### Overview
This project involves the analysis and prediction of diabetes outcomes using a dataset from the Pima Indian Diabetes Database. The dataset contains several medical predictor variables and one target variable (Outcome). This project involves data preprocessing, visualization, model training, and evaluation to predict whether a person is diabetic or not.
### Dataset
The dataset used is `diabetes.csv`, which includes the following columns:
- `Pregnancies`: Number of times pregnant
- `Glucose`: Plasma glucose concentration
- `BloodPressure`: Diastolic blood pressure (mm Hg)
- `SkinThickness`: Triceps skinfold thickness (mm)
- `Insulin`: 2-Hour serum insulin (mu U/ml)
- `BMI`: Body mass index (weight in kg/(height in m)^2)
- `DiabetesPedigreeFunction`: Diabetes pedigree function
- `Age`: Age (years)
- `Outcome`: Class variable (0 or 1), indicating whether the patient is diabetic or not
### Requirements
- Python 3.x
- Libraries: numpy, pandas, matplotlib, seaborn, scikit-learn
### Installation
To run the project, ensure you have the required libraries installed. You can install them using pip:
```sh
pip install numpy pandas matplotlib seaborn scikit-learn
```
### Project Steps
1. **Import Libraries**: Import the necessary libraries for data processing, visualization, and machine learning.
2. **Load Dataset**: Read the dataset using pandas and display its head, info, and descriptive statistics.
3. **Data Cleaning**:
- Remove duplicate rows.
- Check for missing values and zeros in certain columns.
- Replace zero values in specific columns with the mean or median of that column.
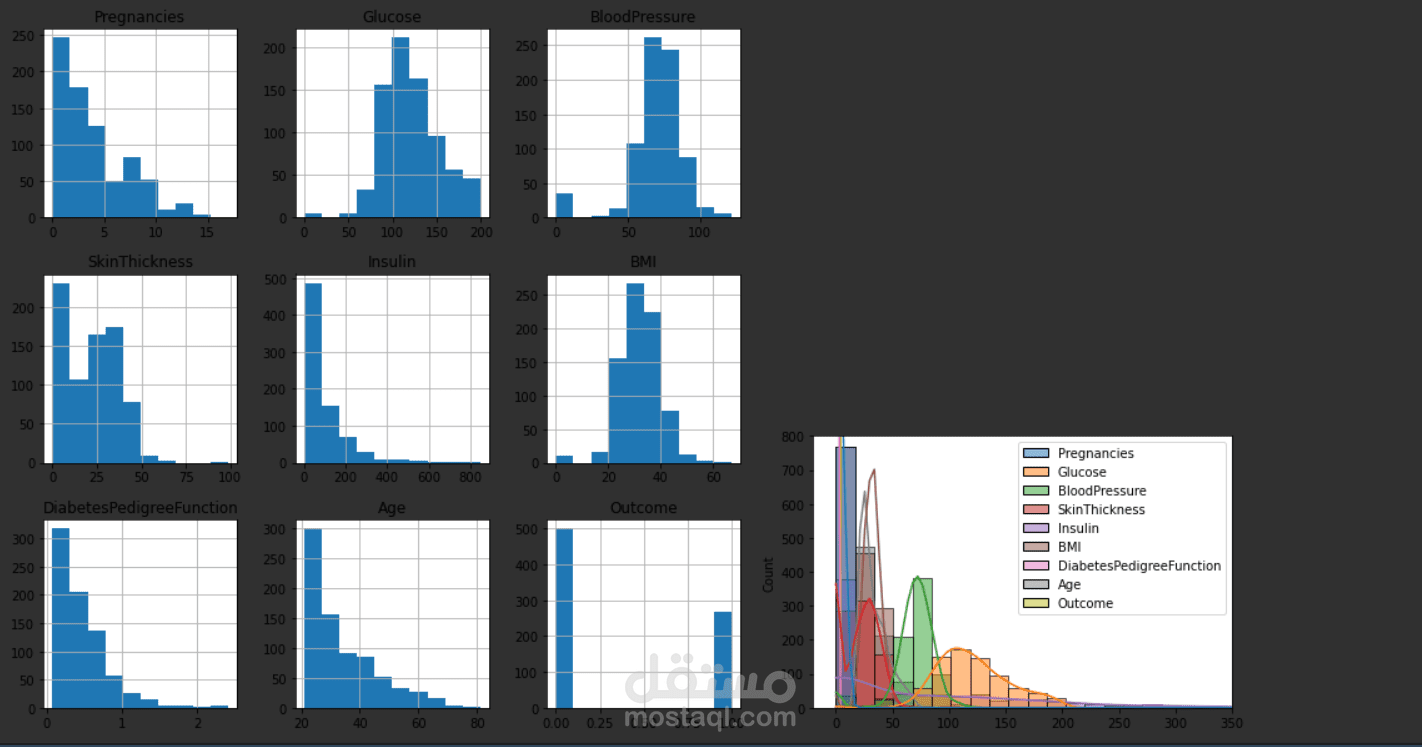
4. **Data Visualization**:
- Plot histograms and boxplots for each column.
- Visualize the relationships between various features.
5. **Feature Selection**:
- Analyze the correlation matrix and remove non-influential columns.
6. **Data Normalization**:
- Normalize the features using `QuantileTransformer`.
7. **Model Training and Evaluation**:
- Split the data into training and testing sets.
- Train three models: Decision Tree, Random Forest, and Support Vector Machine (SVM).
- Evaluate the models using accuracy, precision, recall, and F1 score.
- Select the best performing model based on accuracy.
- Plot the confusion matrix for the best model.
8. **Predictive System**:
- Accept user input for new data.
- Normalize the input data and predict the outcome using the best model.
- Display whether the person is diabetic or not based on the prediction.
### Usage
1. **Run the Script**: Execute the Python script to perform data analysis, model training, and evaluation.
2. **Input New Data**: After the model evaluation, the script will prompt for new input data to predict whether a person is diabetic.
### Conclusion
This project demonstrates the process of cleaning, analyzing, visualizing, and modeling data to predict diabetes outcomes. The Random Forest model was identified as the best performing model, and a predictive system was built to classify new patient data based on the trained model.
### Future Work
- Explore additional feature engineering techniques.
- Implement cross-validation for more robust model evaluation.
- Experiment with other machine learning algorithms and hyperparameter tuning.