مستشفي
تفاصيل العمل
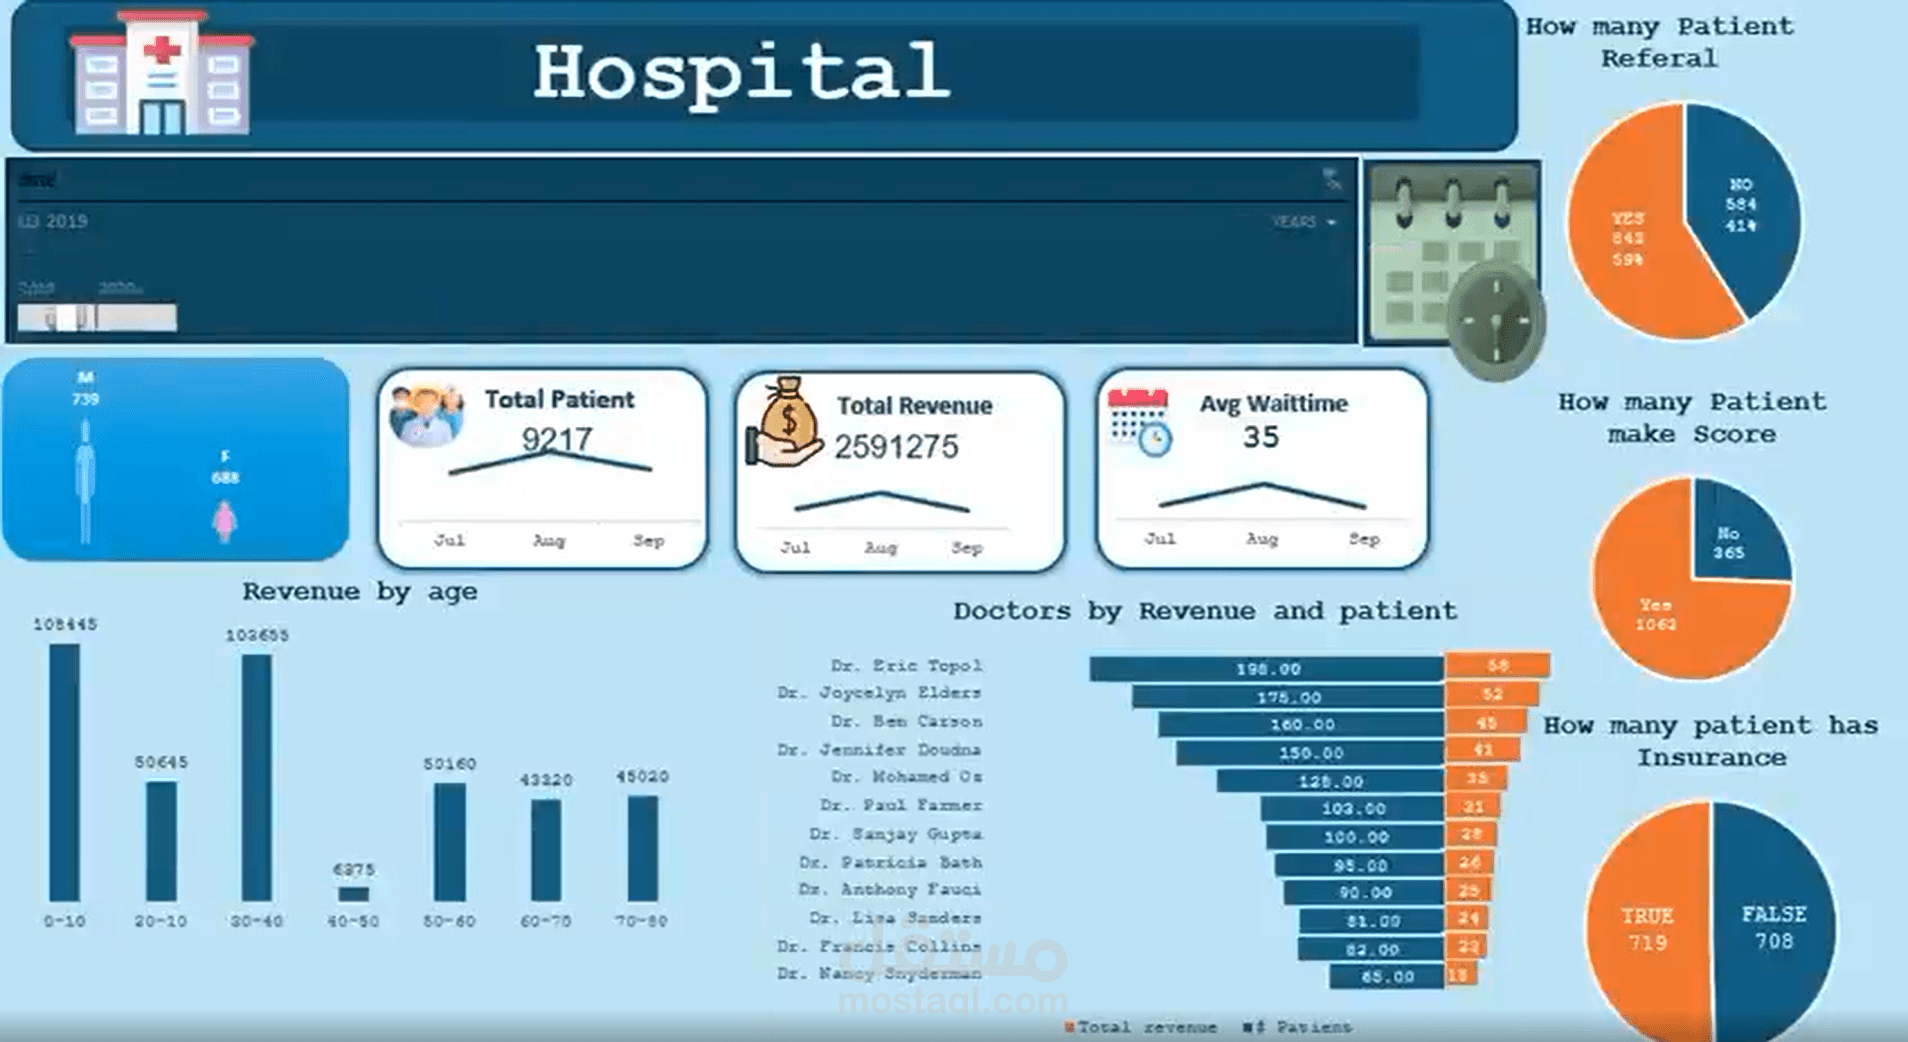
Hospital Dashboard Project – From Raw Data to Insights
Proud to share my recent Excel project where I built a full dashboard to analyze hospital data. Here's how I approached the project step by step:
1. Data Cleaning
Collected and cleaned raw hospital data.
Fixed missing values, removed duplicates, and standardized columns.
2. Data Preparation
Used Excel functions and formulas to structure the data.
Prepared patient details, revenue figures, insurance info, etc.
3. KPI Calculation
Calculated key metrics such as:
Total Patients
Total Revenue
Average Wait Time
Revenue by Age Group
Patient Referrals, Scoring, and Insurance Stats
4. Data Visualization
Created an interactive Excel dashboard.
Used charts, graphs, and cards to display KPIs clearly.
Visualized insights by gender, age group, and doctor performance.
This project helped me strengthen my data analysis and Excel visualization skills.
Looking forward to hearing your feedback!