Movie Popularity and Performance Analysis (1990s–2020s) Using Power BI
تفاصيل العمل
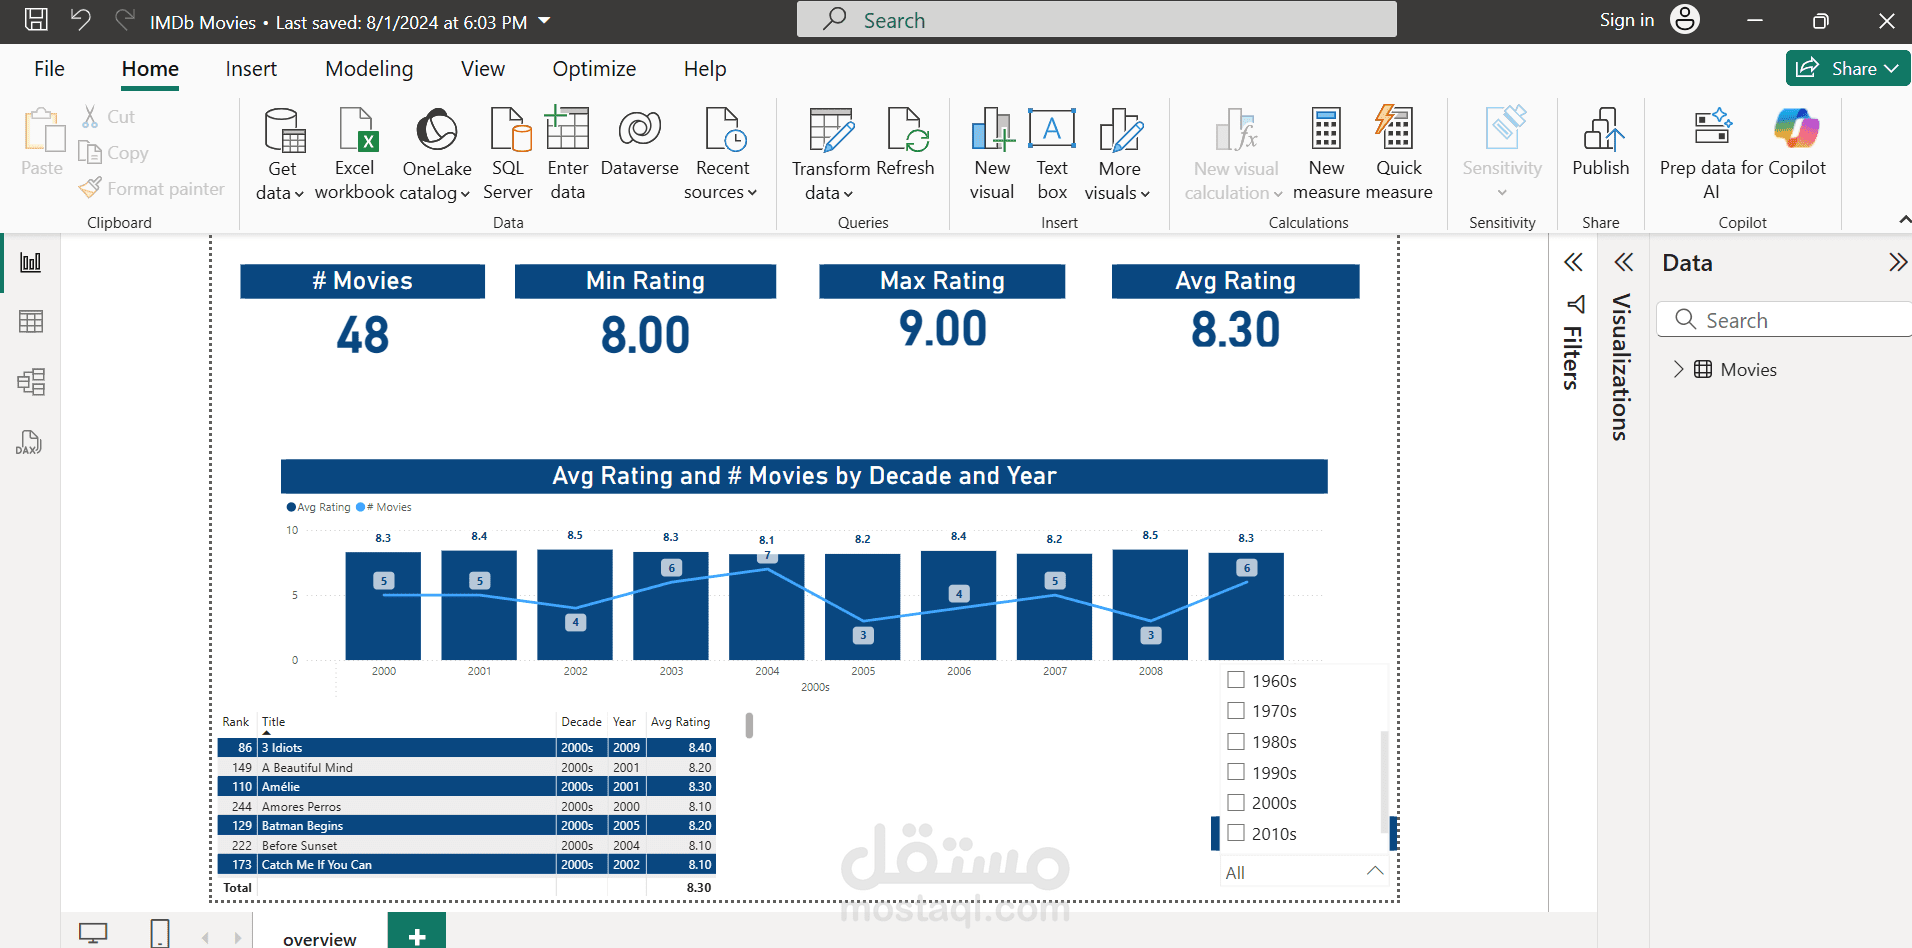
This project analyzes movie performance over three decades—from the 1990s through the 2020s—to identify:
The most-watched movies in each era and overall.
The best-rated movies across genres and time periods.
Trends in audience preferences over time.
Objectives:
Compare movie success across the 1990s, 2000s, 2010s, and 2020s.
Understand how viewership and ratings have evolved.
Highlight the most popular and influential films of each decade.
Data Sources:
A dataset containing detailed records for movies released between 1990 and 2023, including:
Movie Title
Release Year
Number of Views / Tickets Sold
Average Rating
Box Office Revenue
Genre
Production Studio
Methodology:
Data Preparation:
Import data into Power BI.
Clean and normalize the date formats (e.g., extract Decade column).
Create calculated fields such as:
Total Views
Average Rating
Revenue
Decade Category (e.g., 1990s, 2000s)
Visualizations:
Bar and Column Charts:
Top 10 most-watched movies by decade.
Top 10 highest-rated movies by decade.
Line Charts:
Annual trends in movie viewership from 1990 to 2023.
Pie or Donut Charts:
Distribution of genres per decade.
Slicers and filters to:
Select decade
Filter by genre
Filter by rating or revenue range
KPIs and Insights:
Most Watched Movie Overall (1990–2023)
Best Rated Movie Overall (1990–2023)
Most Watched Movie per Decade
Genre Popularity Trends
Correlation between revenue and audience ratings over time
Reporting and Sharing:
An interactive dashboard allowing users to:
Explore performance decade by decade
Identify shifts in audience preferences
Download reports or export visuals
Publish to Power BI service for web-based access
Outcomes:
A clear historical overview of movie popularity trends over 30+ years.
Insights into which movies defined each decade.
Data-driven recommendations for content strategy and marketing.