Supermarket Analytics Dashboard
تفاصيل العمل
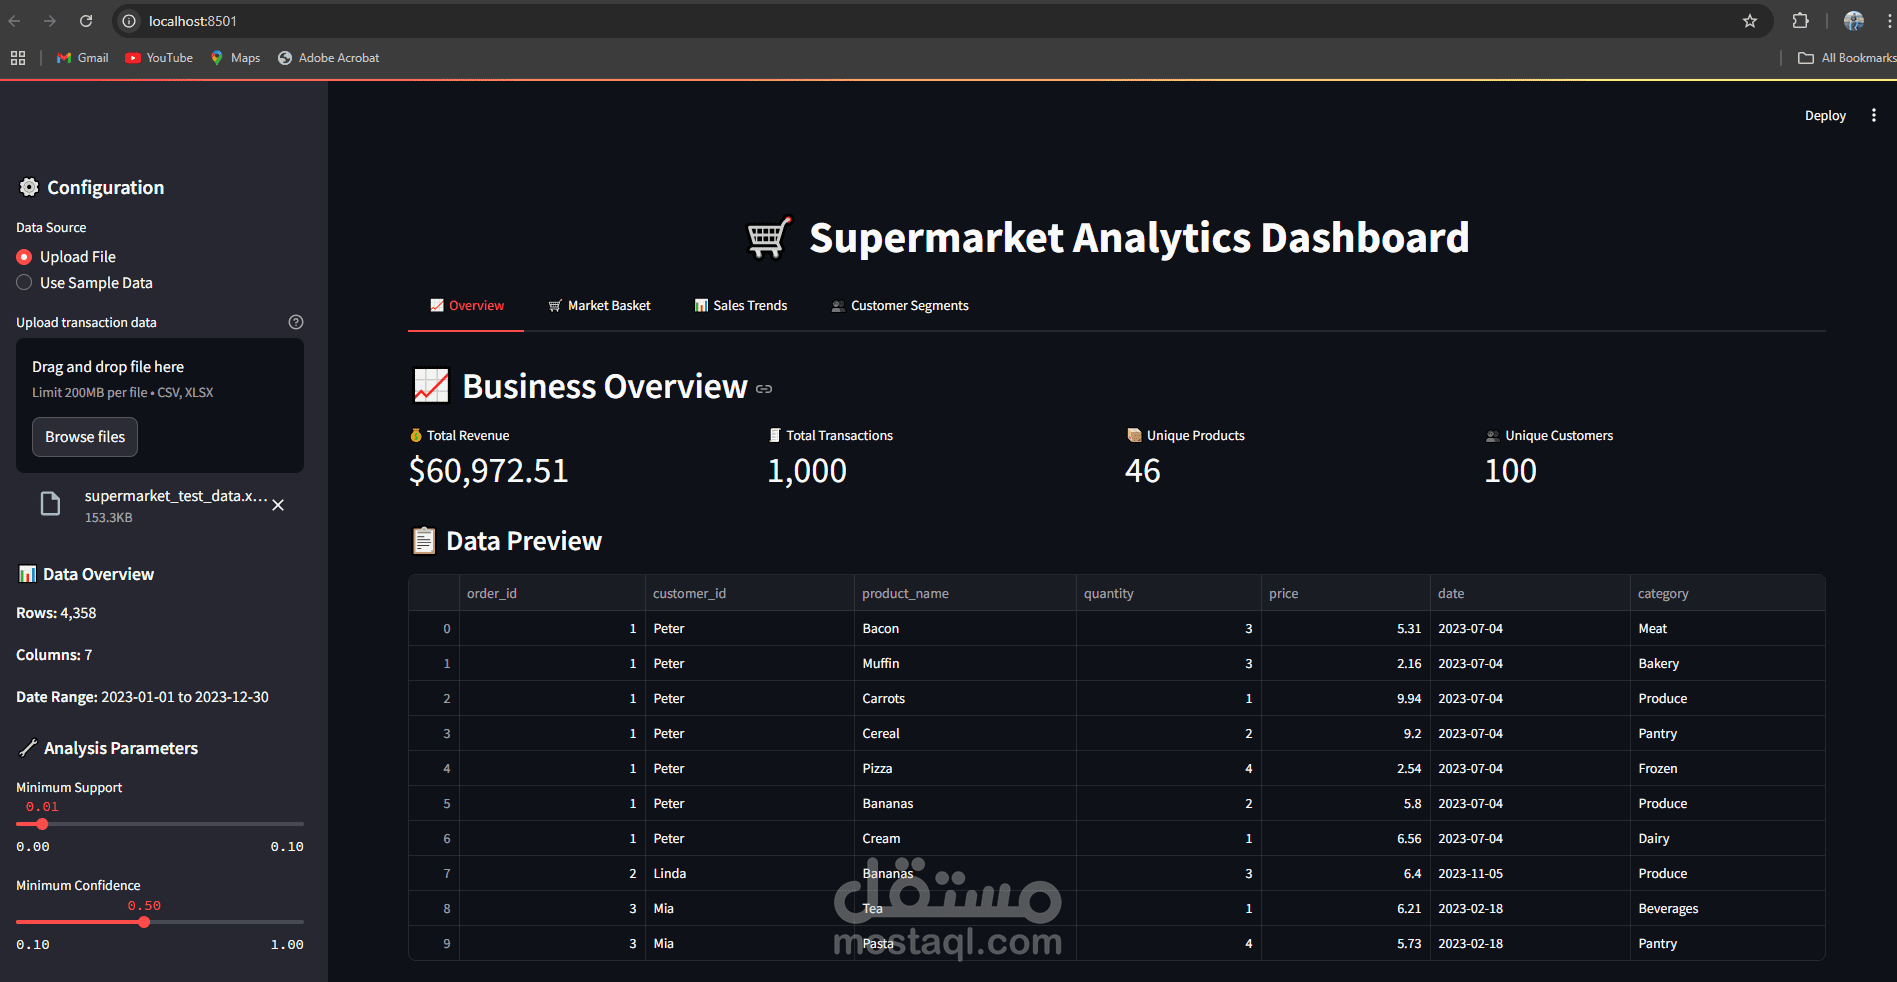

Supermarket Analytics Dashboard with Streamlit
In this project, I built an interactive Streamlit app to analyze supermarket sales data. The idea is simple: the store owner uploads a CSV or Excel file, and the app instantly shows useful insights.
Key features:
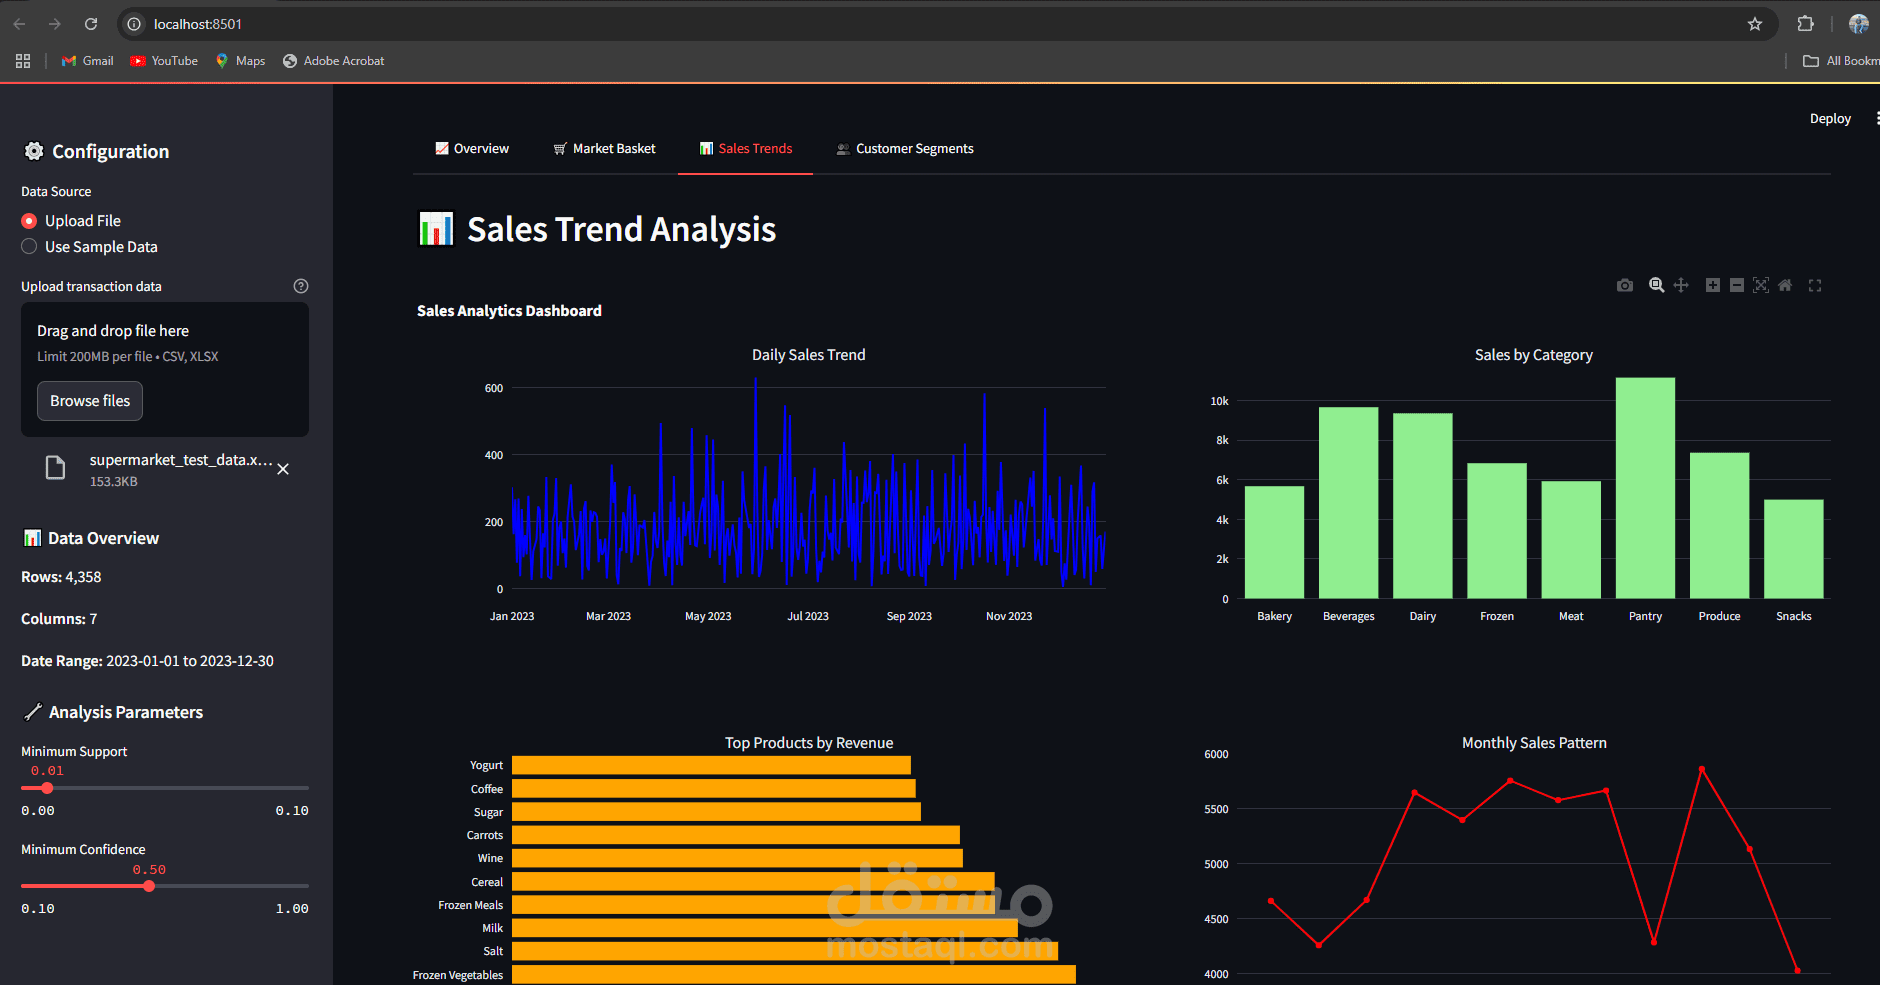
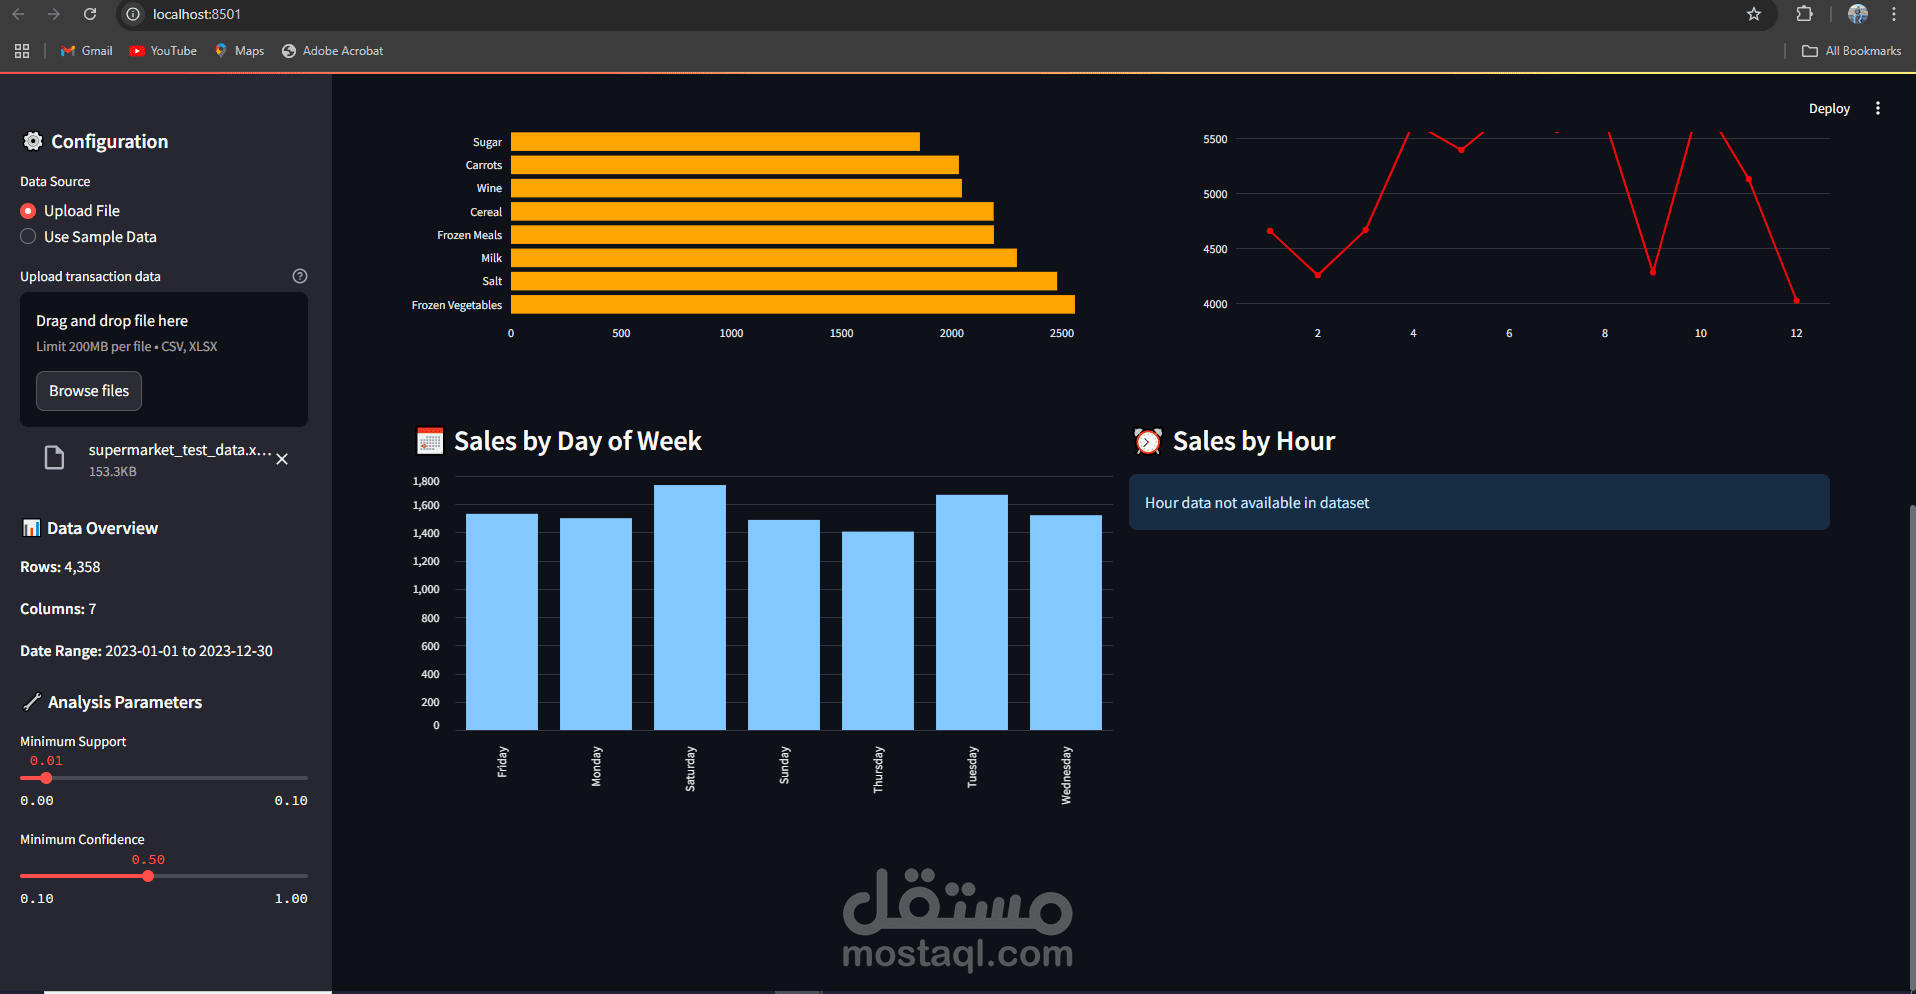
Sales Analysis: daily trends, top products, category-wise sales – all visualized.
Market Basket Analysis using Apriori & Association Rules for smart recommendations.
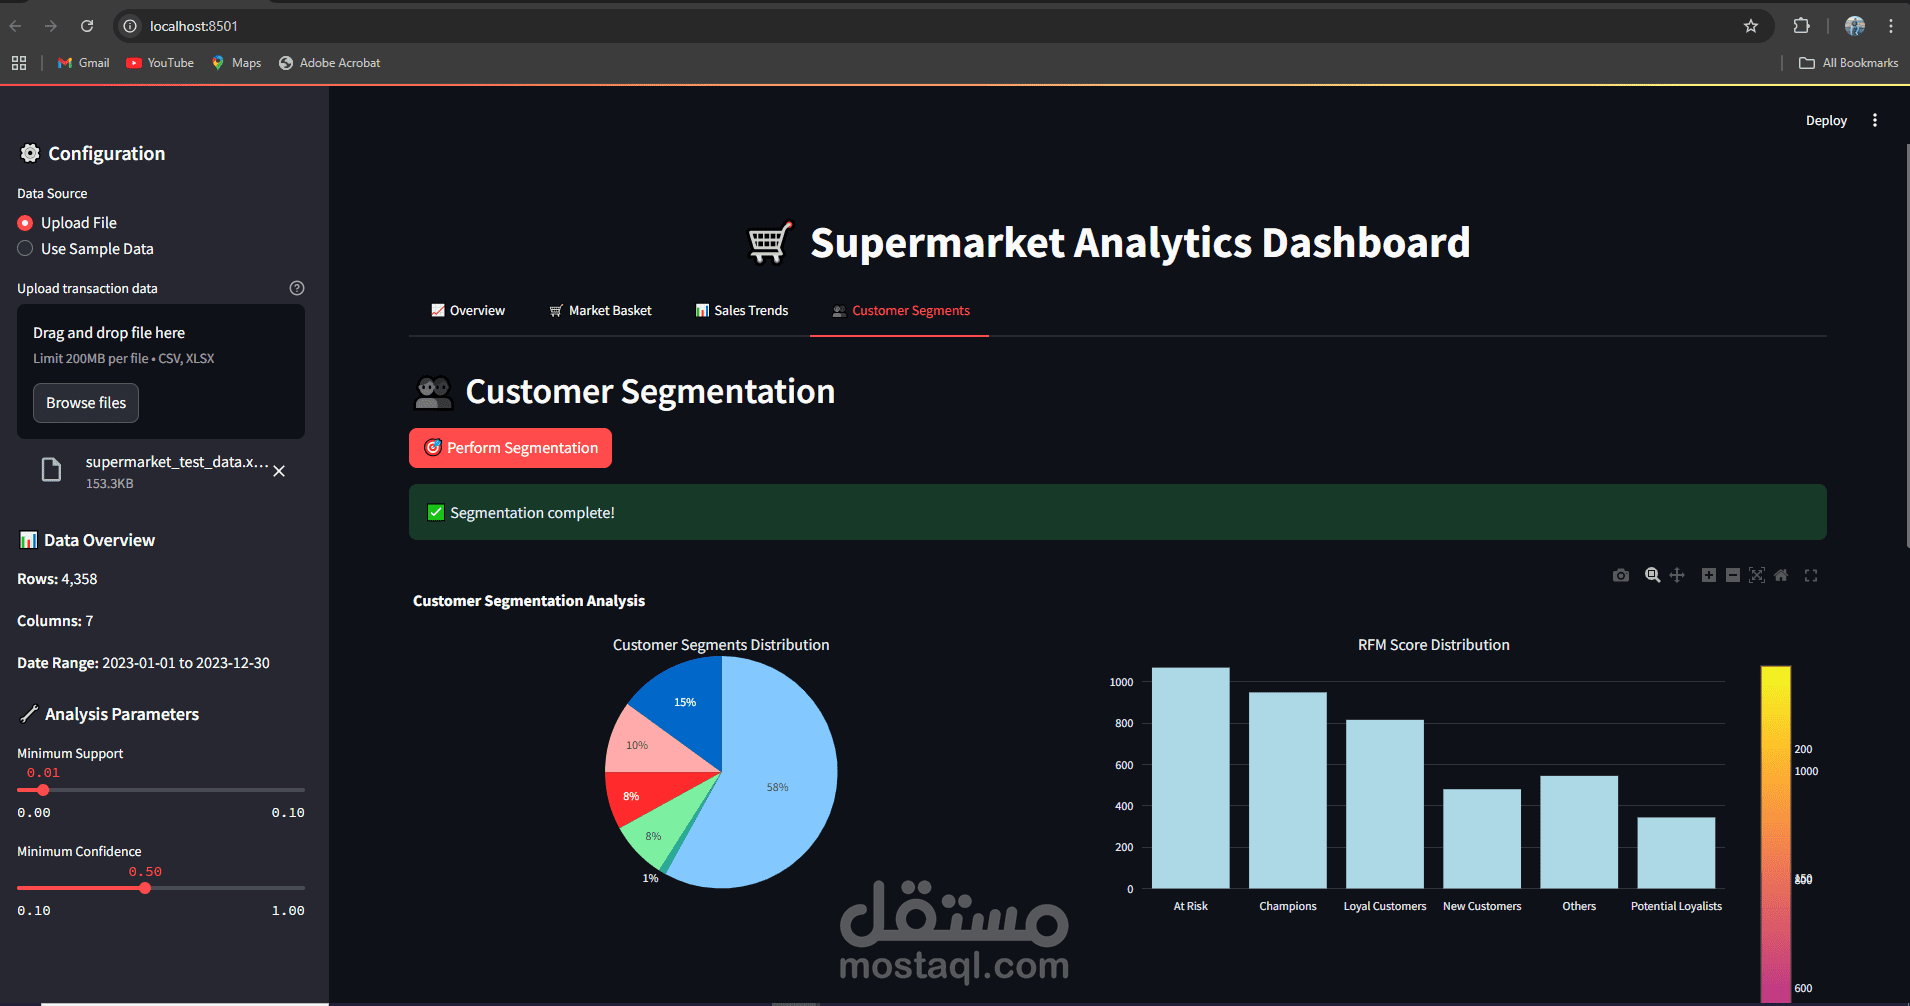
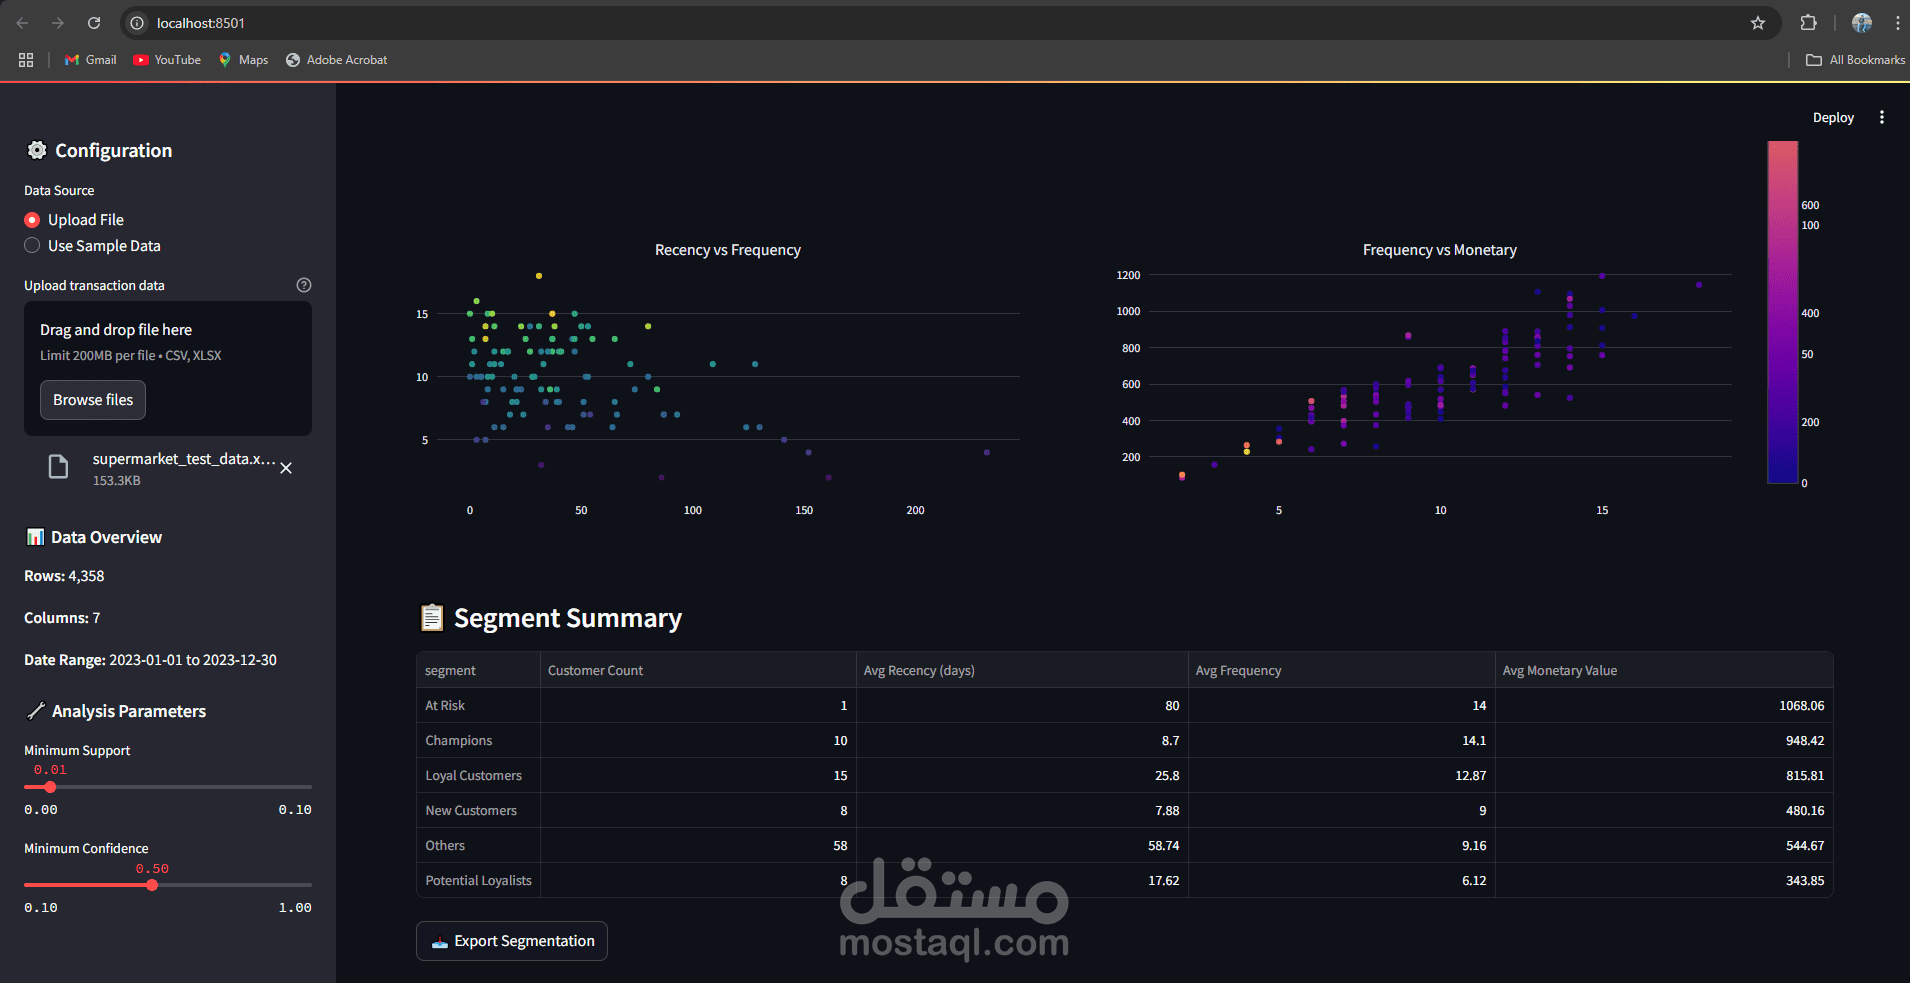
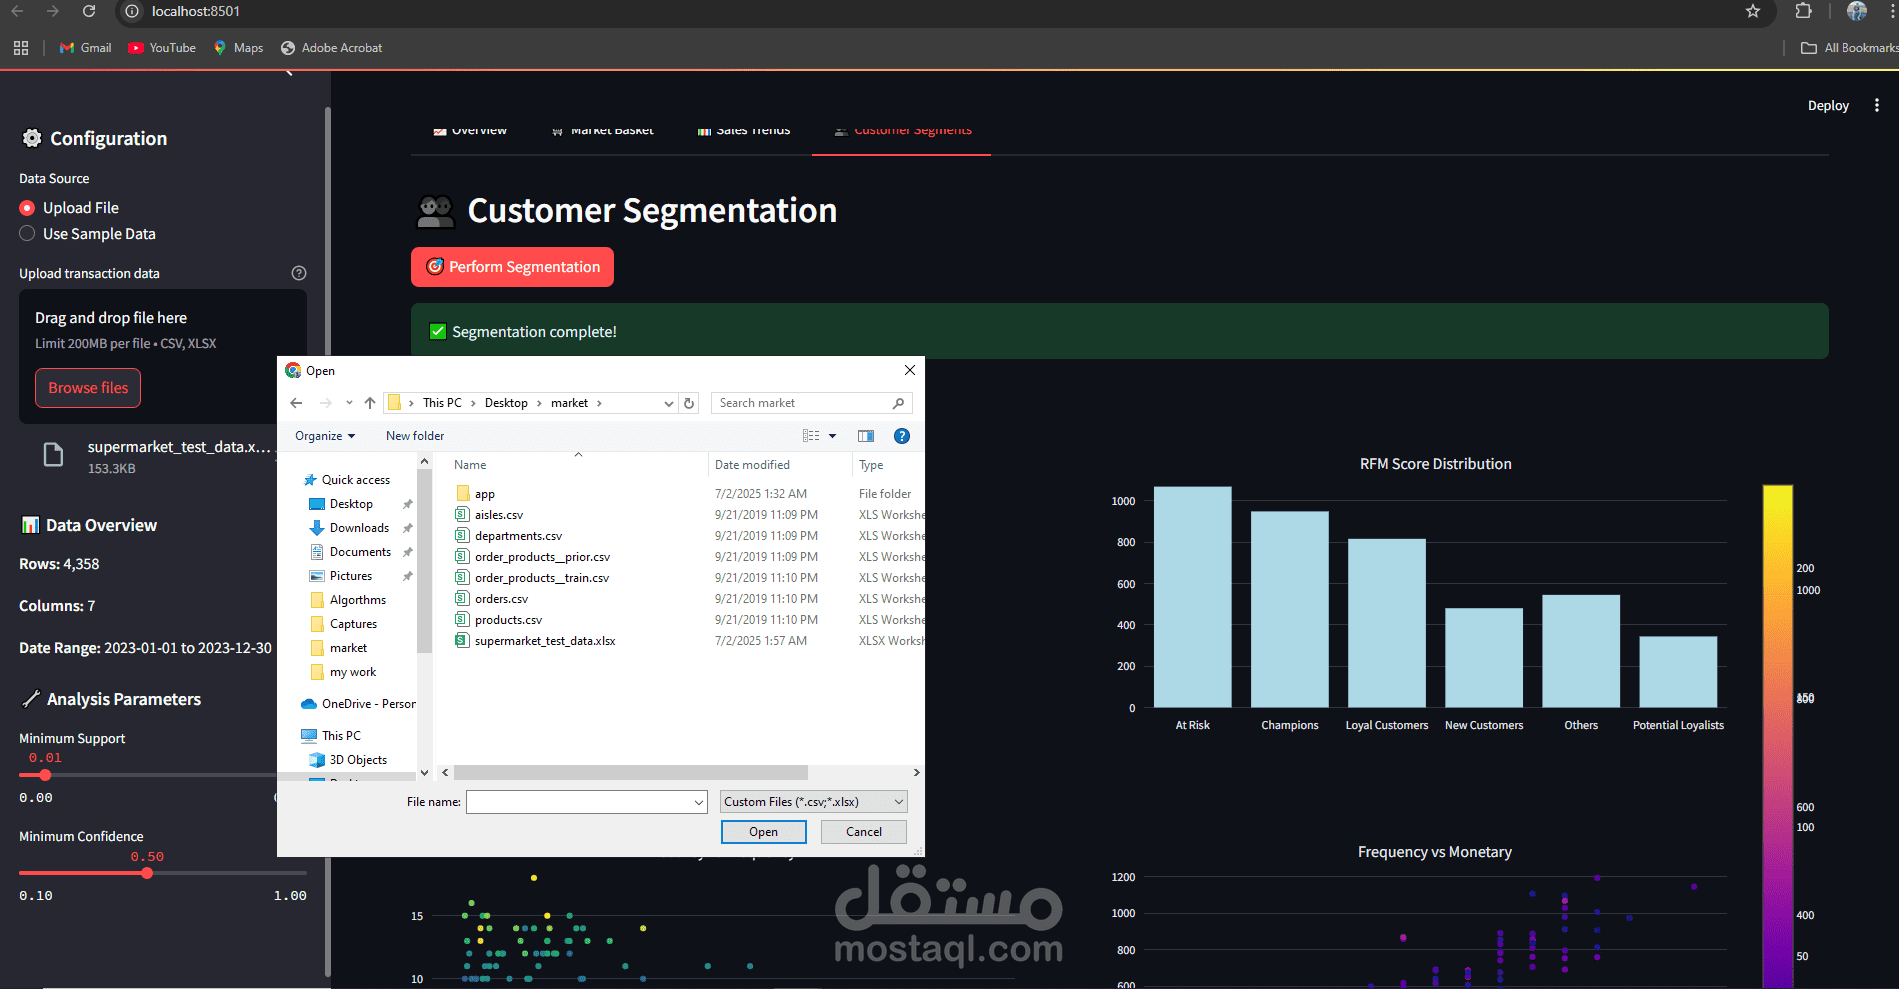
Customer Segmentation based on RFM (Recency, Frequency, Monetary) to identify loyal, new, or at-risk customers.
Interactive Visualizations: charts, graphs, and network diagrams.
Easy Export of results as CSV.
Supports custom data upload or sample data for testing.
The goal is to give the business owner a clear view of their sales and customer behavior to boost profits and spot new selling opportunities.