Coffee sales dashboard
تفاصيل العمل

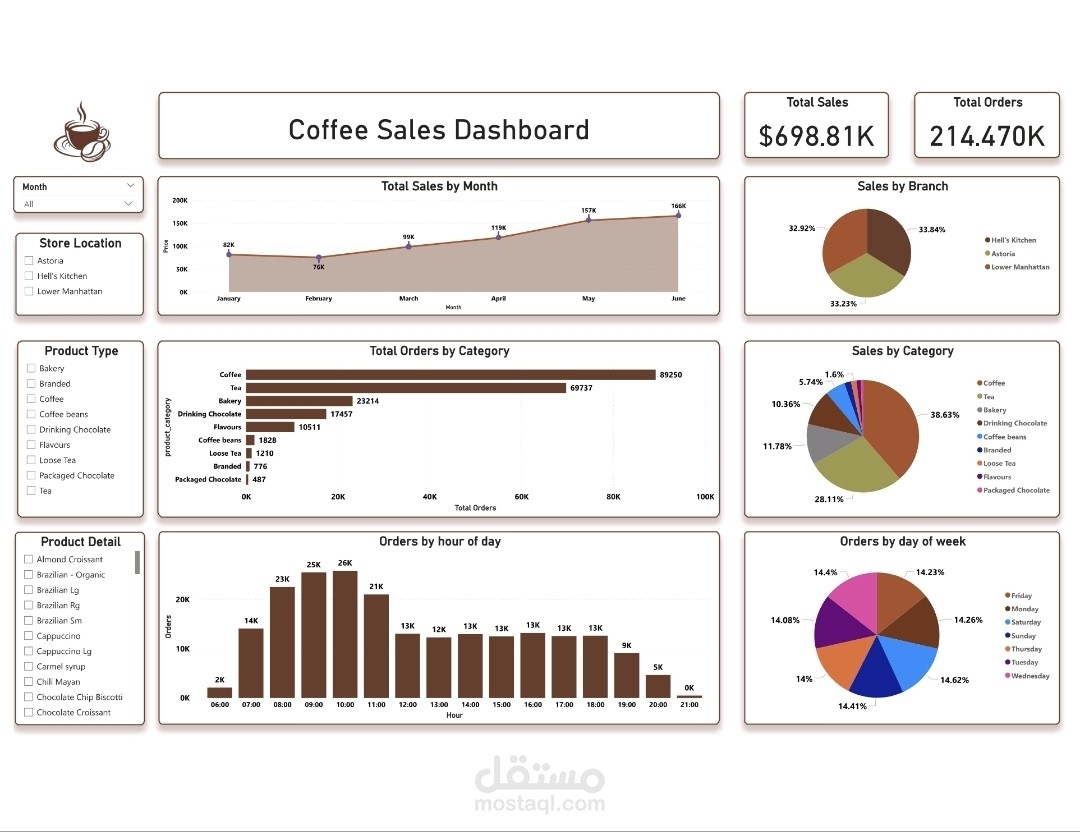
Sales Dashboard – Power BI Project
As part of the Brainwave Matrix Solutions scholarship program, I completed this sales dashboard as my first Power BI task!
The goal was to analyze and visualize coffee shop sales data in a clear and engaging way.
Dashboard Highlights:
Total sales & orders overview
Monthly & hourly sales trends
Sales distribution by product category & branch
Customer behavior by day of week and hour of day
️ I used a warm, coffee-inspired color palette to match the theme, and focused on both clarity and aesthetics.
️ Tools used: Power BI, Power Query, DAX
You can view the dashboard and Excel file on my GitHub here: