Supermarket Analysis Dashboard using Power BI
تفاصيل العمل
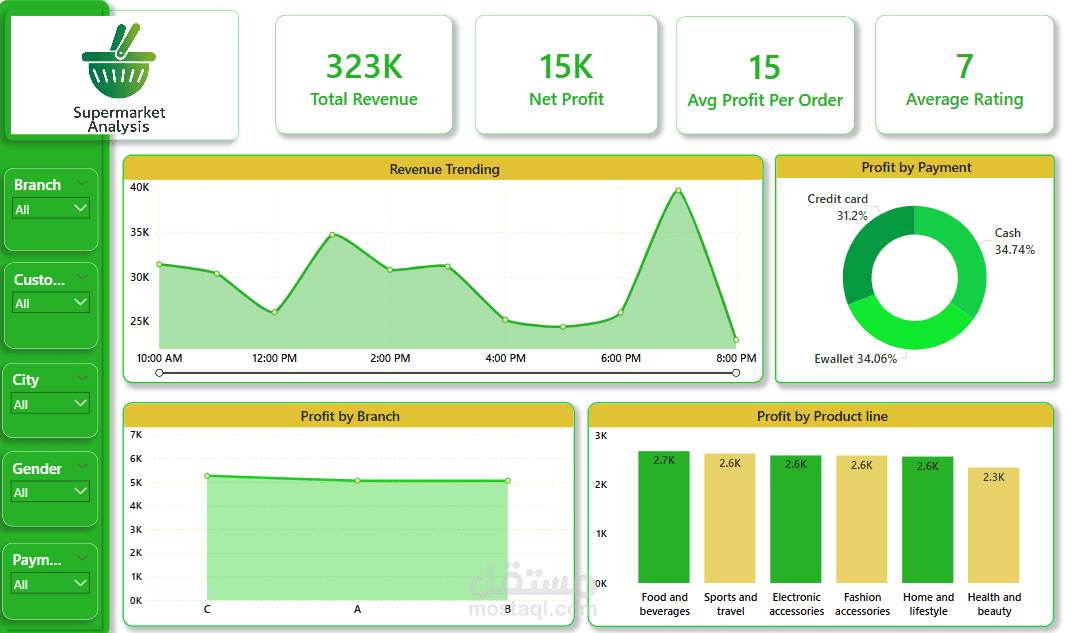
Supermarket Dashboard using Power BI
I made a full analysis of supermarket data to answer questions like:
- Does customer type or gender affect revenue?
- What are the best times of the day for sales?
- Which payment method brings the most profit?
- What are the differences between branches in rating and profit?
- Which product line gives the highest profit?
Insights:
Branch C has the highest rating and profit.
Food & Beverages is the top product line in rating and profit.
Cash payments bring higher profit than other methods.
Members spend more than normal customers.