Power BI Dashboard
تفاصيل العمل
Quick Hands-on Session with Power BI – Second Session!
Along with my learning journey at the Information Technology Institute (ITI) in the Power BI Development and Business Intelligence Track.
I had the opportunity today to build another visual dashboard using real-world data from the World University Rankings 2025.
A special thank you to Bassant Mohamed for her time, guidance, and continuous support during the session — your insights truly made a difference and helped bring the data to life!
I really enjoyed blending my data analysis skills with my graphic design background — which is reflected in the consistent color scheme across the visuals to match the CWUR logo colors. Visual storytelling matters!
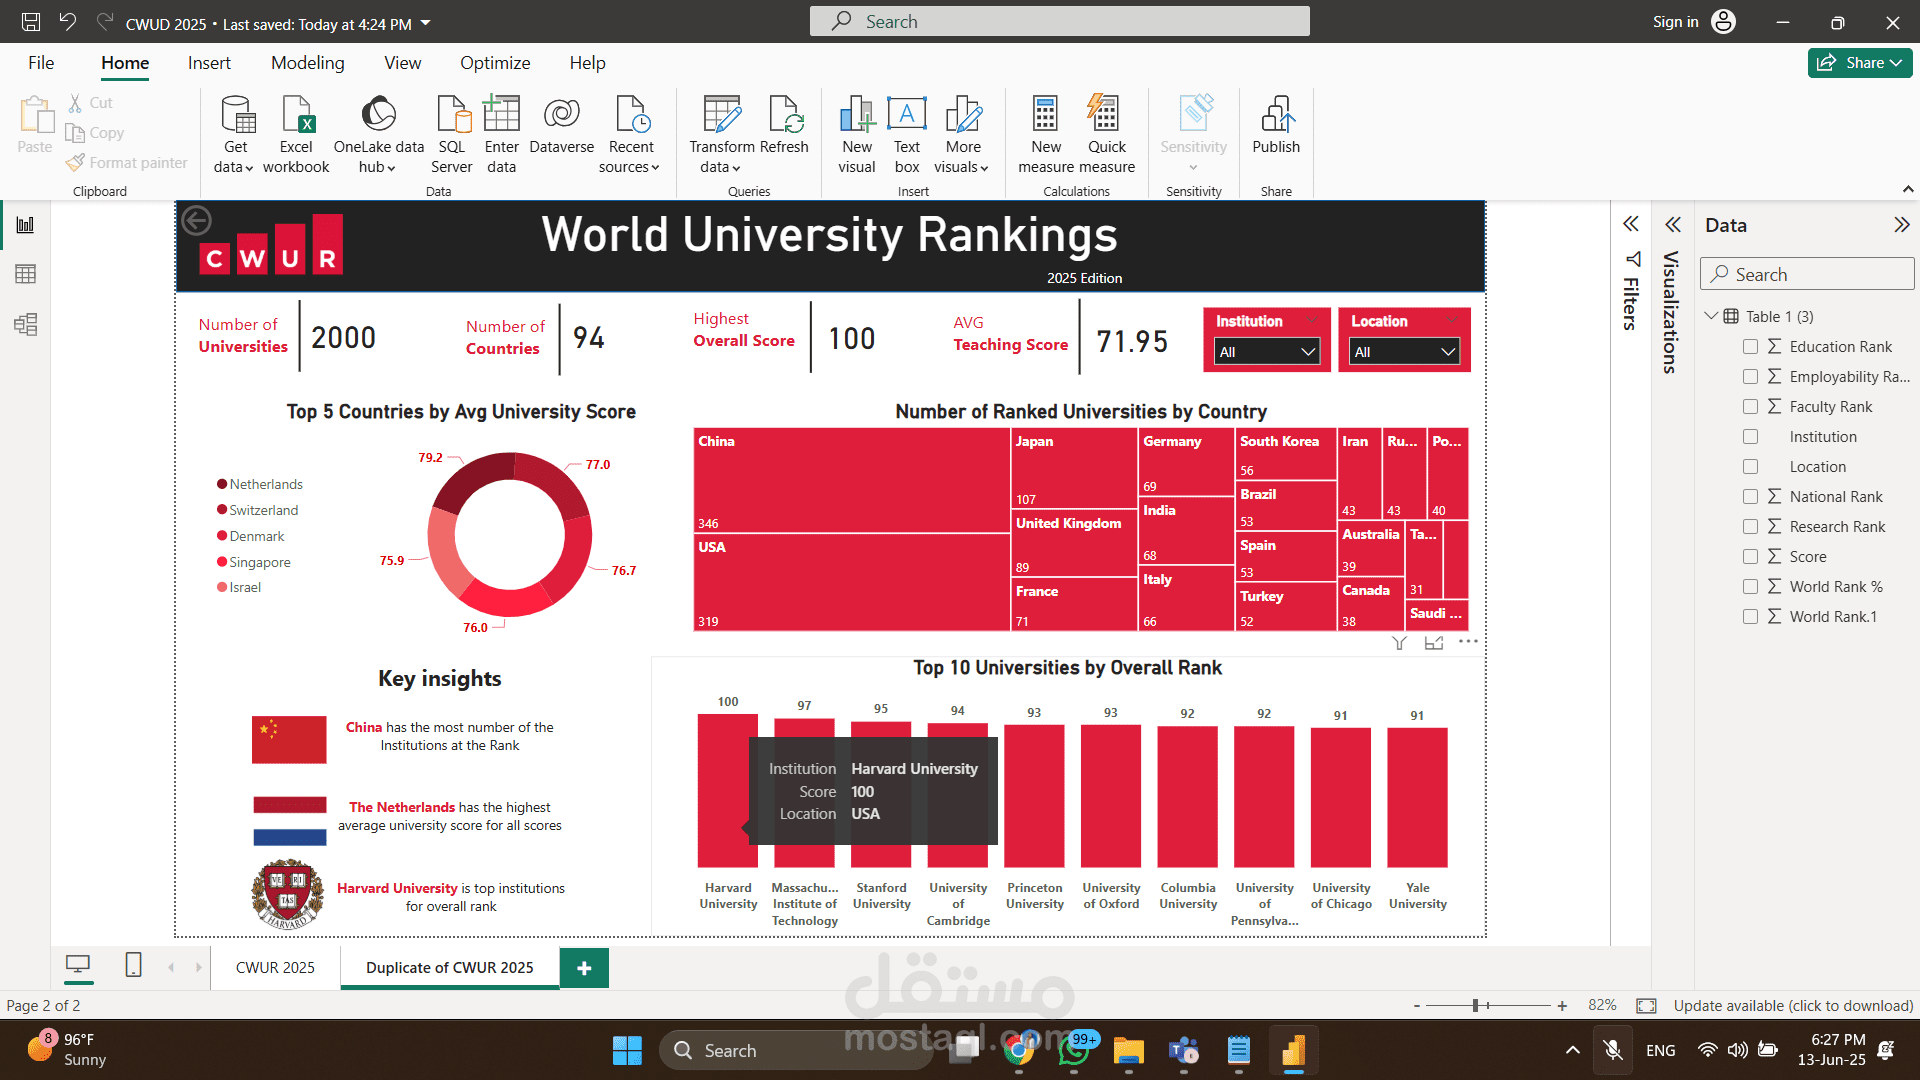
Key Insights from My Dashboard:
China has the highest number of ranked universities.
Harvard University ranks #1 worldwide with a perfect score of 100 — not a surprise, but always inspiring!
The Netherlands leads in average university scores, showcasing the high quality of education across its institutions.
The dashboard highlights top-performing universities and countries along with overall ranking insights.
Data Source: Center for World University Rankings (CWUR) – 2025 Edition
This journey is just getting started, and I’m excited to continue exploring the world of data visualization and analytics!