Sales Dashboard
تفاصيل العمل
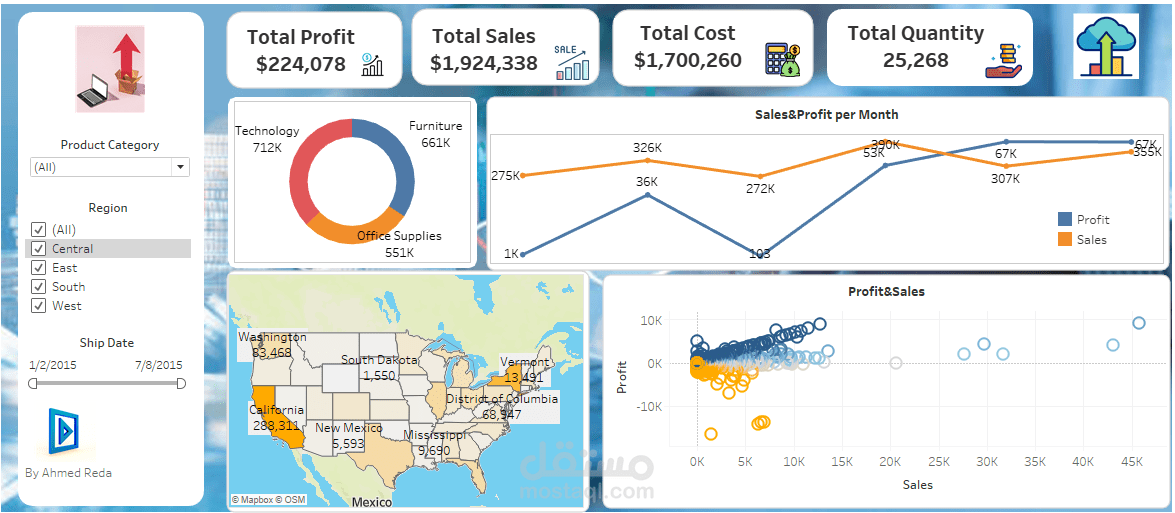

Sales Performance Dashboard - Tableau This repository contains my first interactive dashboard built using Tableau, focused on analyzing sales performance across different regions and product categories.
Dashboard Features: Total Profit, Sales, Cost, and Quantity
Monthly Sales vs. Profit Trend
Sales by Product Category
Sales Distribution by Region (Map View)
Sales vs. Profit Correlation (Scatter Plot)
Interactive filters for Product Category, Region, and Date
Tools Used: Tableau
Excel (Data Source)
GitHub for version control & sharing