Sales Hierarchy by Sub-Category
تفاصيل العمل

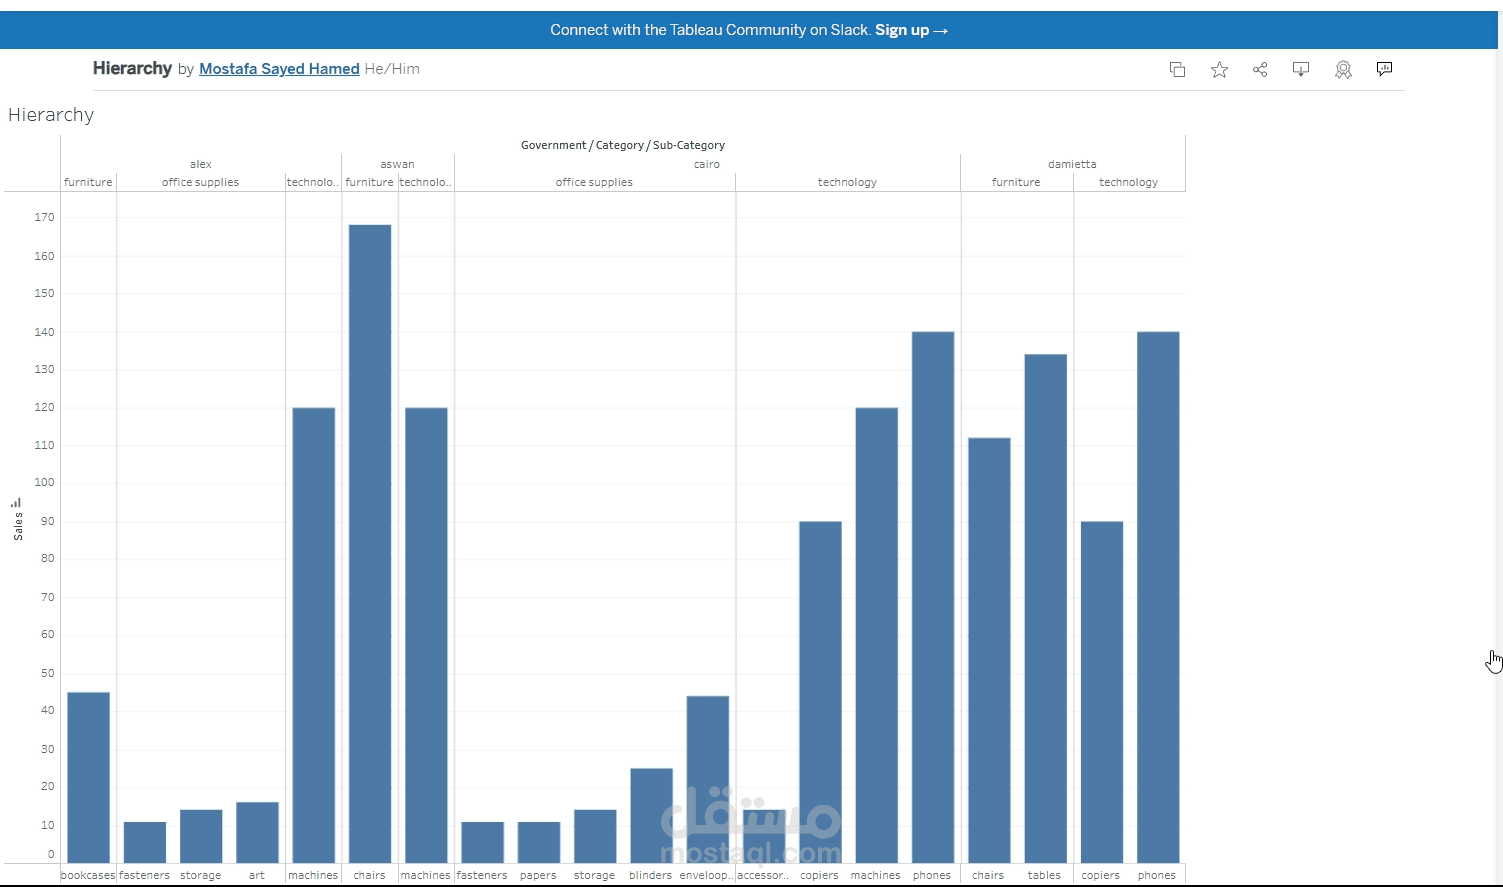
This chart is a bar graph illustrating the sales volume (in units) across various sub-categories within the government sector, grouped by category and sub-category. The y-axis represents sales, ranging from 0 to 180 units, while the x-axis lists sub-categories such as bookcases, fasteners, storage, art, machines, chairs, and others. The highest sales are observed in chairs (around 170 units), followed by machines and phones (around 140-150 units), while bookcases and fasteners show the lowest sales (around 40-50 units), providing a detailed comparison of sales performance across different sub-categories.