Electric-Vehicle-Population-Data-Analysis
تفاصيل العمل
Electric-Vehicle-Population-Data-Analysis
This project focuses on analyzing a real-world dataset titled "Electric Vehicle Population Data", provided by the State of Washington and hosted on Data.gov. The dataset contains detailed information about battery electric vehicles (BEVs) and plug-in hybrid electric vehicles (PHEVs) registered in Washington State.
Objective
The goal of this project is to preprocess the dataset, conduct exploratory data analysis (EDA), and effectively communicate insights derived from the data. This project was completed as part of a group assignment.
Dataset Overview
Source
Electric Vehicle Population Data on Data.gov
Description
The dataset contains information on registered BEVs and PHEVs in Washington State, including:
Vehicle Identification Number (VIN)
County and city of registration
Make and model
Electric type and range
Dataset Features
Number of Features: 17
Temporal Scope: Data spans from model year 2013 to the current year, with regular updates.
Key Features of the Analysis
Data Cleaning and Feature Engineering
Missing Value Analysis
Identified missing data and documented its frequency and distribution.
Applied multiple strategies (e.g., mean/median imputation, dropping rows) and compared their impact.
Feature Encoding
Encoded categorical features (e.g., Make, Model) using one-hot encoding.
Normalization
Normalized numerical features for accurate analysis where necessary.
Exploratory Data Analysis (EDA)
Descriptive Statistics
Calculated summary statistics such as mean, median, and standard deviation for numerical features.
Spatial Distribution
Visualized the distribution of EVs across cities and counties using maps.
Model Popularity
Analyzed trends in the popularity of EV makes and models.
Correlation Analysis
Investigated relationships between numeric features and visualized results.
Visualization
Exploratory Visualizations
Created histograms, scatter plots, boxplots, and bar charts to explore feature relationships.
Comparative Visualizations
Compared the distribution of EVs across locations using bar charts and stacked bar charts.
Additional Analysis (Optional)
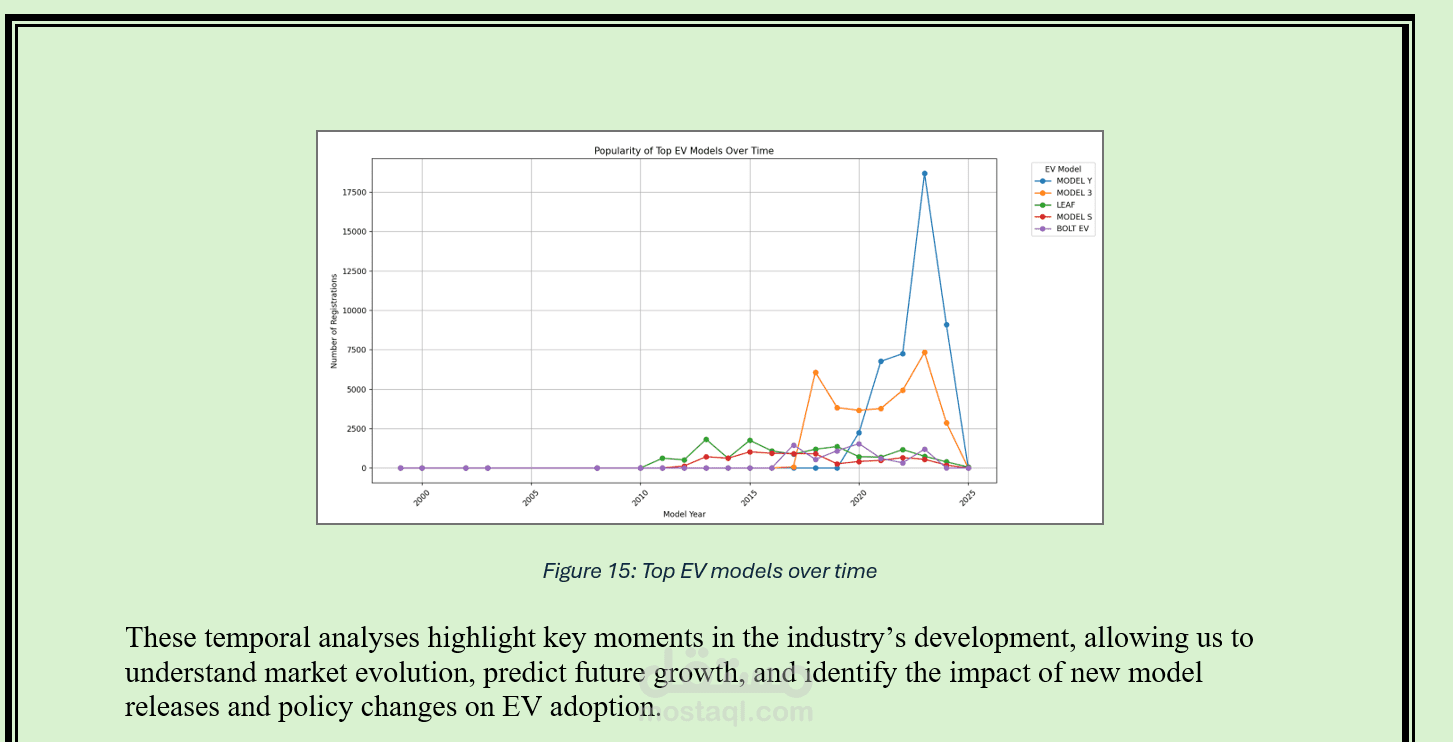
Temporal Analysis
Analyzed EV adoption rates and model popularity over time, if temporal data was available.