E-Commerce Sales analysis using excel
تفاصيل العمل
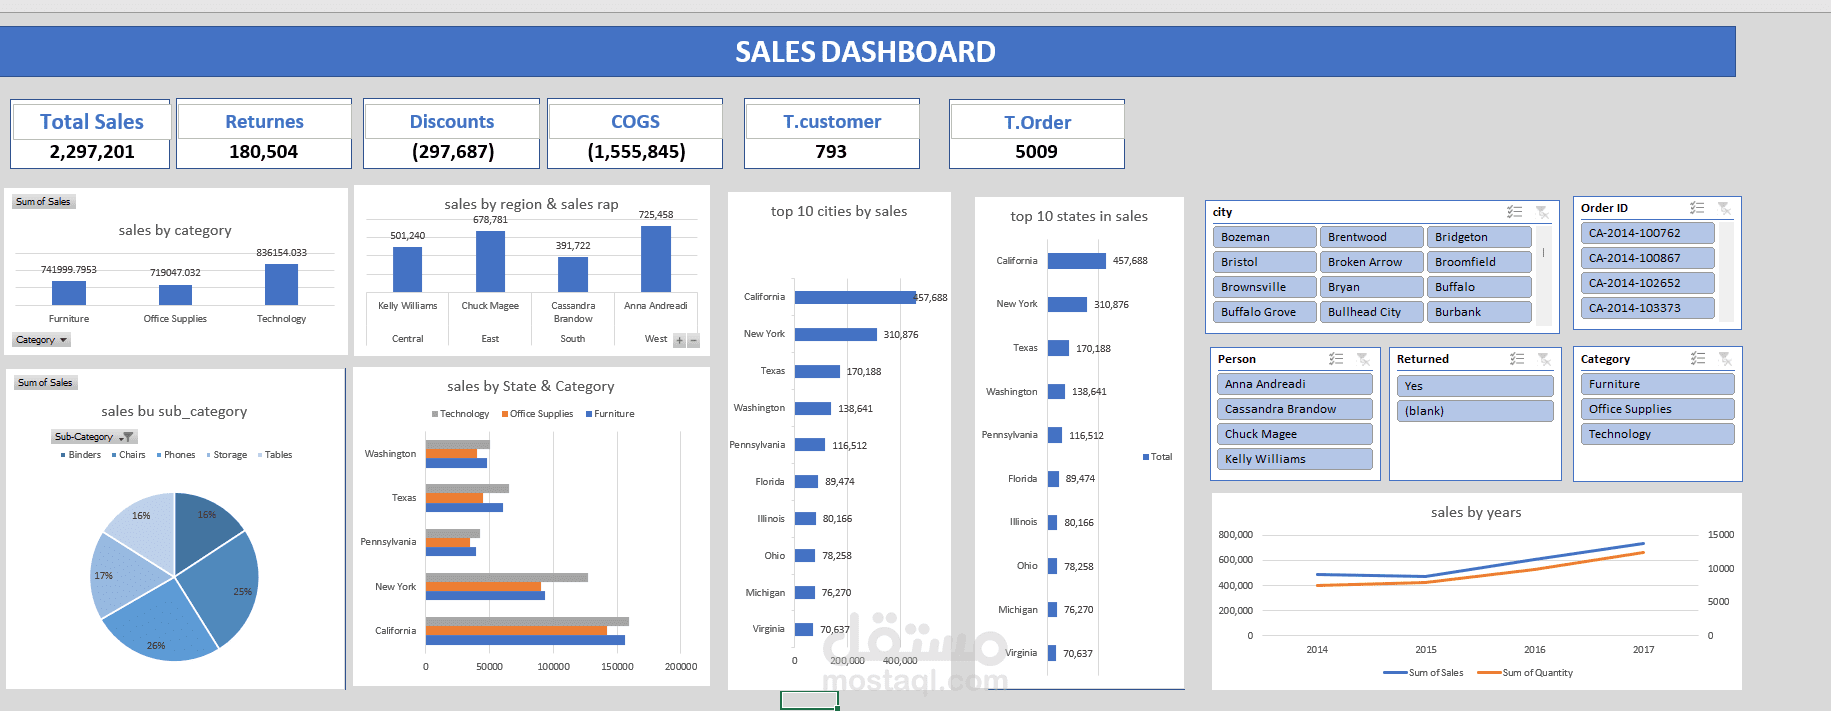
This project is an interactive Sales Dashboard created using Microsoft Excel to analyze and visualize sales data. The dashboard provides insights into total sales, returns, discounts, cost of goods sold (COGS), total customers, total orders, and more. It also includes various visualizations such as:
Sales by Category and Sub-Category
Sales by Region and Sales Representatives
Top 10 Cities & States by Sales
Sales trends over the years
Filters for Cities, Orders, Categories, and Sales Representatives