Sales Performance Dashboard
تفاصيل العمل
Description:
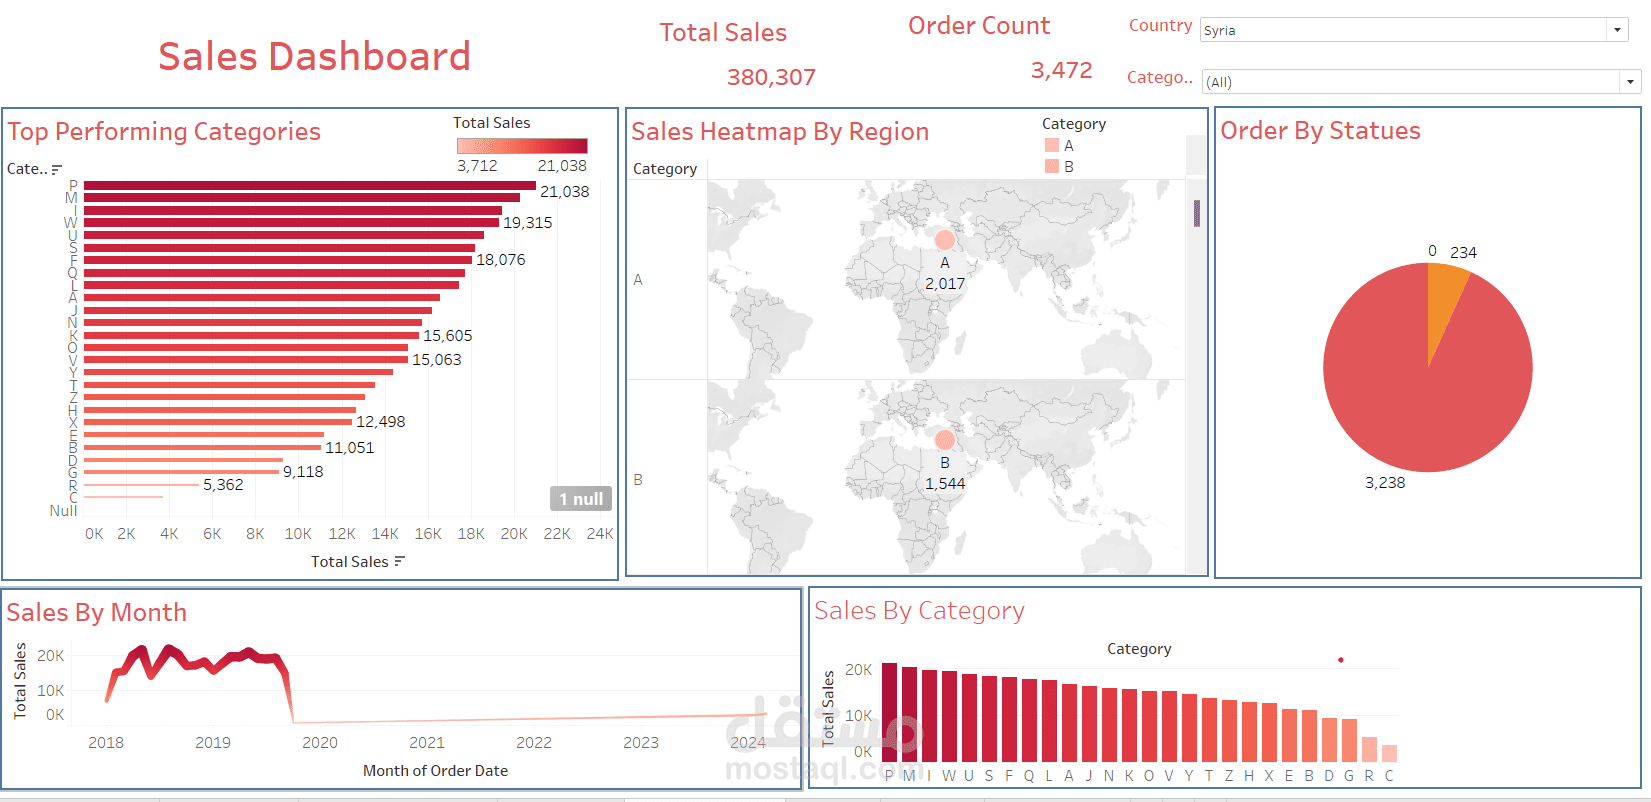
An interactive Tableau dashboard designed to analyze sales performance across different categories, regions, and time periods. The dashboard provides a comprehensive view of key metrics, enabling data-driven decision-making for sales and marketing strategies.
Key Insights & Features:
Top Performing Categories: Highlights the highest-selling product categories (e.g., Category A with 21,038 units sold).
Sales Heatmap by Region: Visualizes regional sales distribution to identify high-performing and underperforming markets.
Order Status Tracking: Tracks order fulfillment stages (e.g., 3,238 orders processed) to assess operational efficiency.
Monthly & Yearly Sales Trends: Analyzes sales patterns over time (2018–2024) to identify seasonal peaks and growth trends.
Sales by Category: Compares category-wise performance to optimize inventory and promotions.
Tools & Techniques:
Interactive Filters: Dynamic controls for real-time data exploration.
Heatmaps & Bar Charts: Visual tools for quick trend recognition.
Time-Series Analysis: Reveals long-term sales patterns and anomalies.