Bike Store Sales Performance Dashboard – Power BI Project
تفاصيل العمل

Bike Store Sales Performance Dashboard – Power BI Project
Designed and developed a dynamic sales dashboard for a bike store using Power BI, focusing on key performance indicators such as revenue, orders, returns, and profit trends.
Tools & Technologies:
Power BI for dashboard creation and data visualization
SQL and Power Query for data transformation and modeling
Star Schema data model to ensure performance and clarity
DAX for calculated measures like Return Rate, Monthly Profit, and Revenue Trends
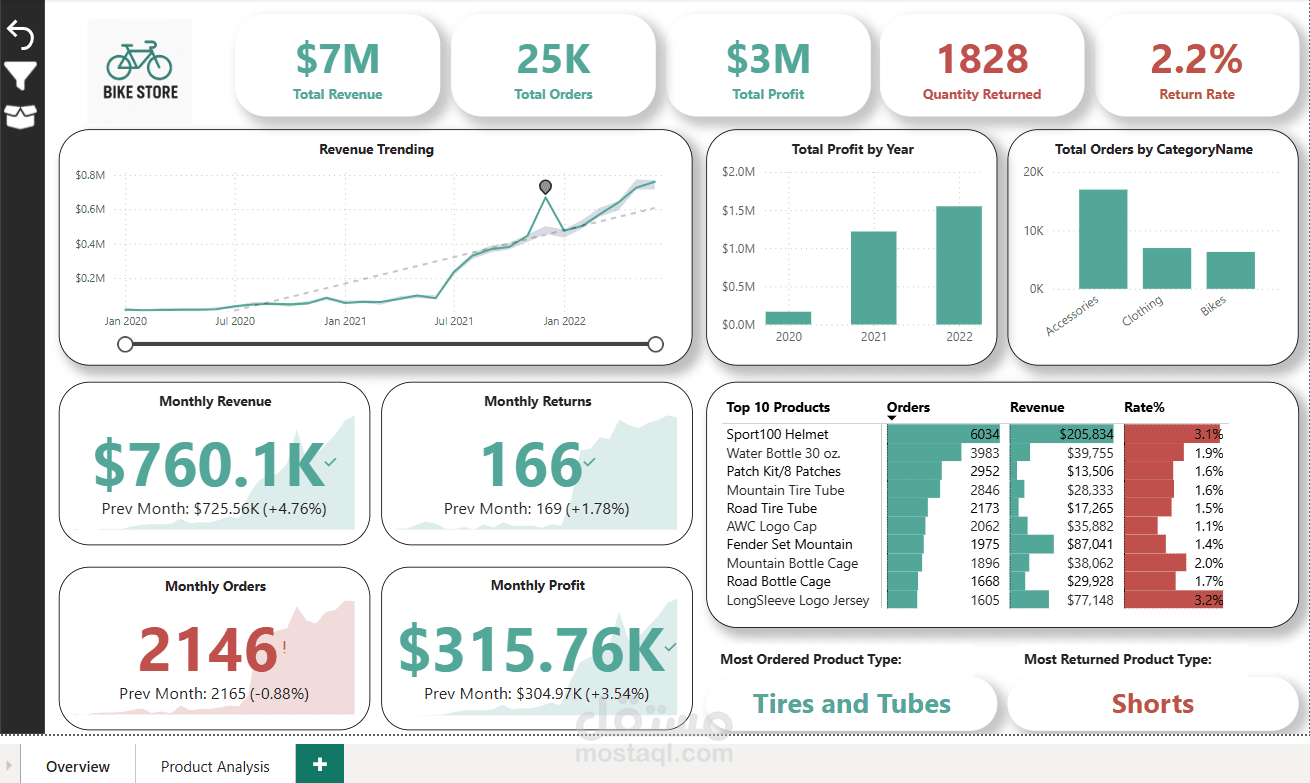
Dashboard Highlights:
Total Revenue: $7M | Total Orders: 25K | Return Rate: 2.2%
Monthly KPIs: Revenue ($760K), Profit ($315K), Orders (2,146), Returns (166)
Product analysis showing most sold and most returned items
Revenue trend line with YoY growth indicators
Most ordered product type: Tires and Tubes
Most returned product type: Shorts
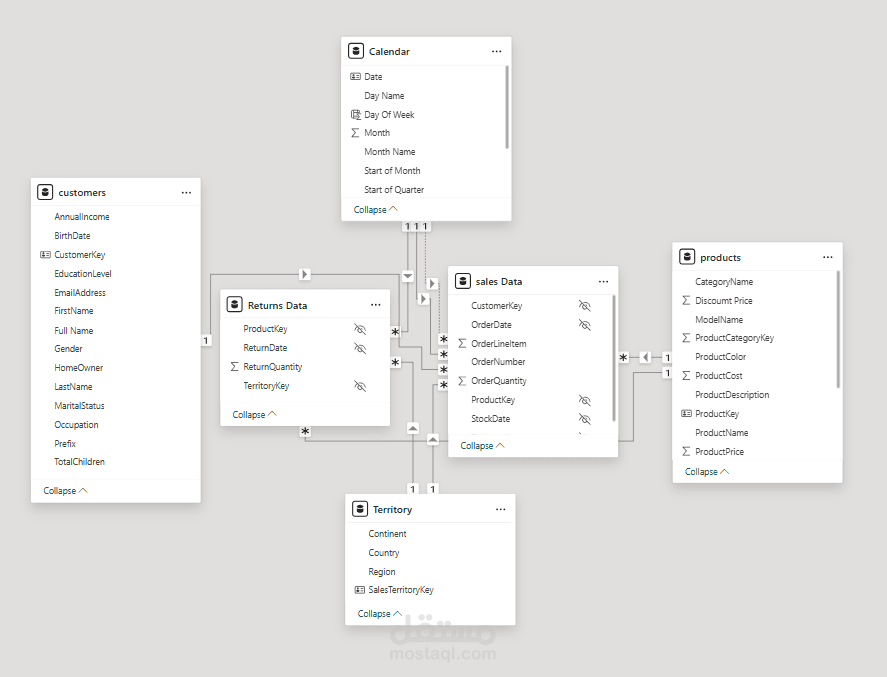
Data Model:
Implemented a Star Schema consisting of:
Fact Tables: Sales Data, Returns Data
Dimension Tables: Calendar, Customers, Products, Territory
Ensured proper relationships and granularity for accurate aggregation
Impact:
Provided clear business insights to help stakeholders identify top-performing products, track return rates, and monitor sales trends over time for better decision-making.