Retail Market Performance Dashboard – Power BI Project
تفاصيل العمل

Retail Market Performance Dashboard – Power BI Project
Designed a comprehensive sales and profit dashboard for Maven Market using Power BI to monitor real-time performance against goals and analyze brand-level and regional trends.
Tools & Technologies:
Power BI for dashboard development and geospatial visualization
DAX for goal tracking KPIs and profit margin calculations
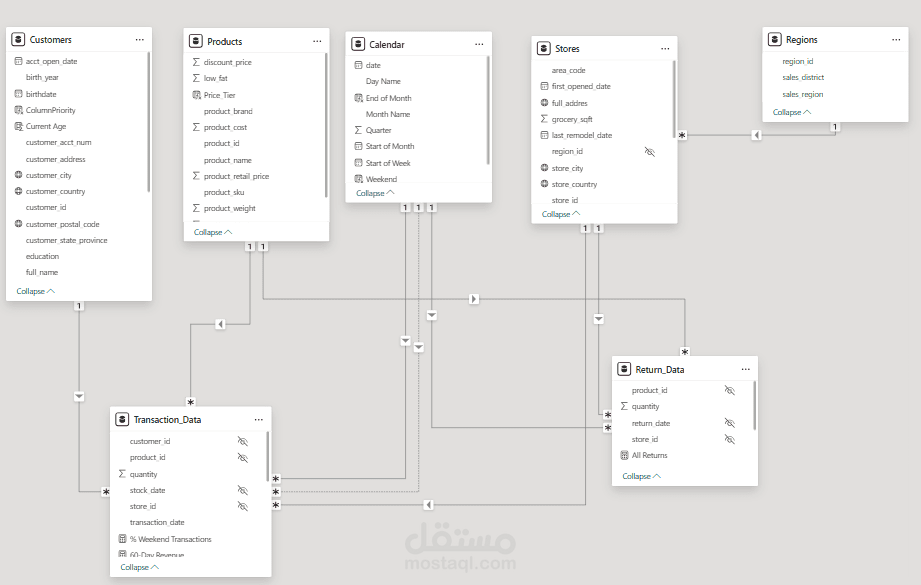
Power Query for data cleansing and transformation
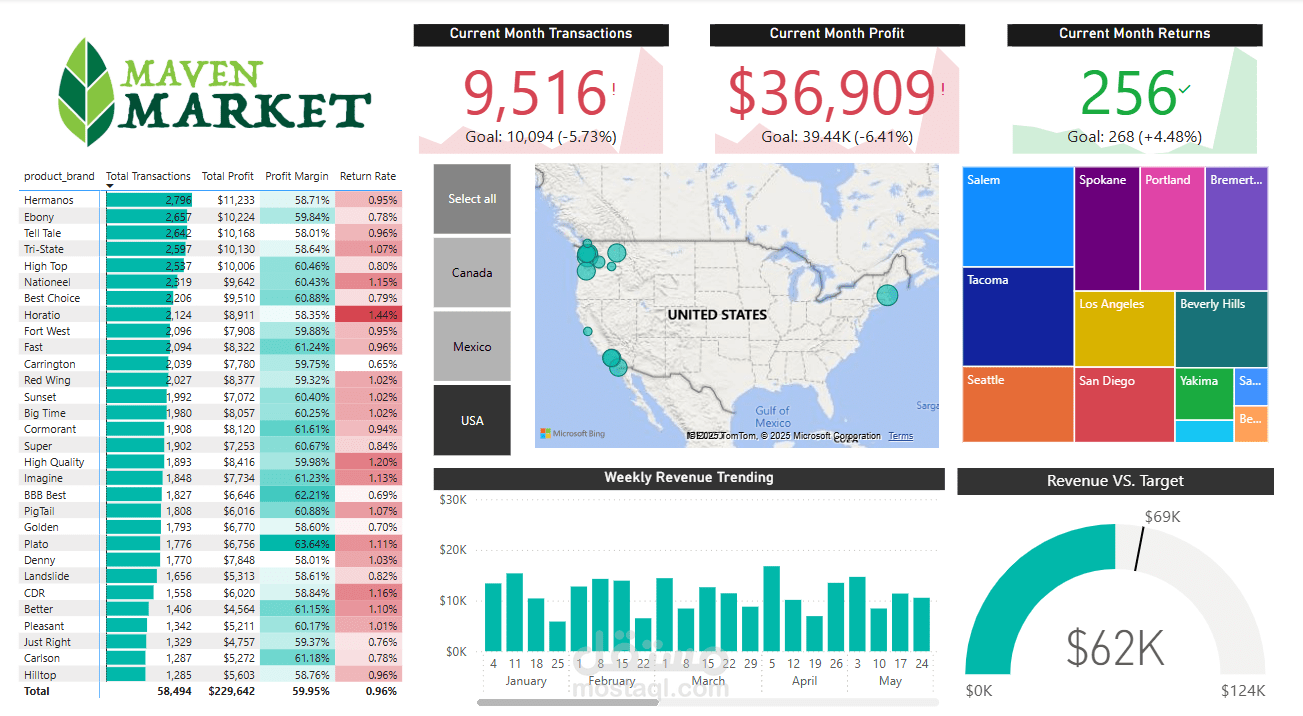
Dashboard Features:
Current Month KPIs:
Transactions: 9,516 (−5.73% from goal)
Profit: $36,909 (−6.41% from goal)
Returns: 256 (+4.48% improvement over target)
Product Brand Analysis:
Displays total transactions, profit, margin, and return rate
Best performing brands by profit margin and lowest return rate
Geographic Analysis:
Interactive map showing store performance across the US, Canada, and Mexico
Weekly Revenue Trending:
Bar chart visualizing revenue flow week over week
Treemap by City:
Return trends by city to detect regional product or service issues
Gauge Visual (Revenue vs. Target):
Shows current revenue ($62K) vs target ($69K) in a clear visual indicator
Business Impact:
Empowered regional managers and brand stakeholders with clear, real-time insights into sales, profitability, and returns, helping them take action to optimize performance.