تحليل الببيانات باستخدام Power BI
تفاصيل العمل
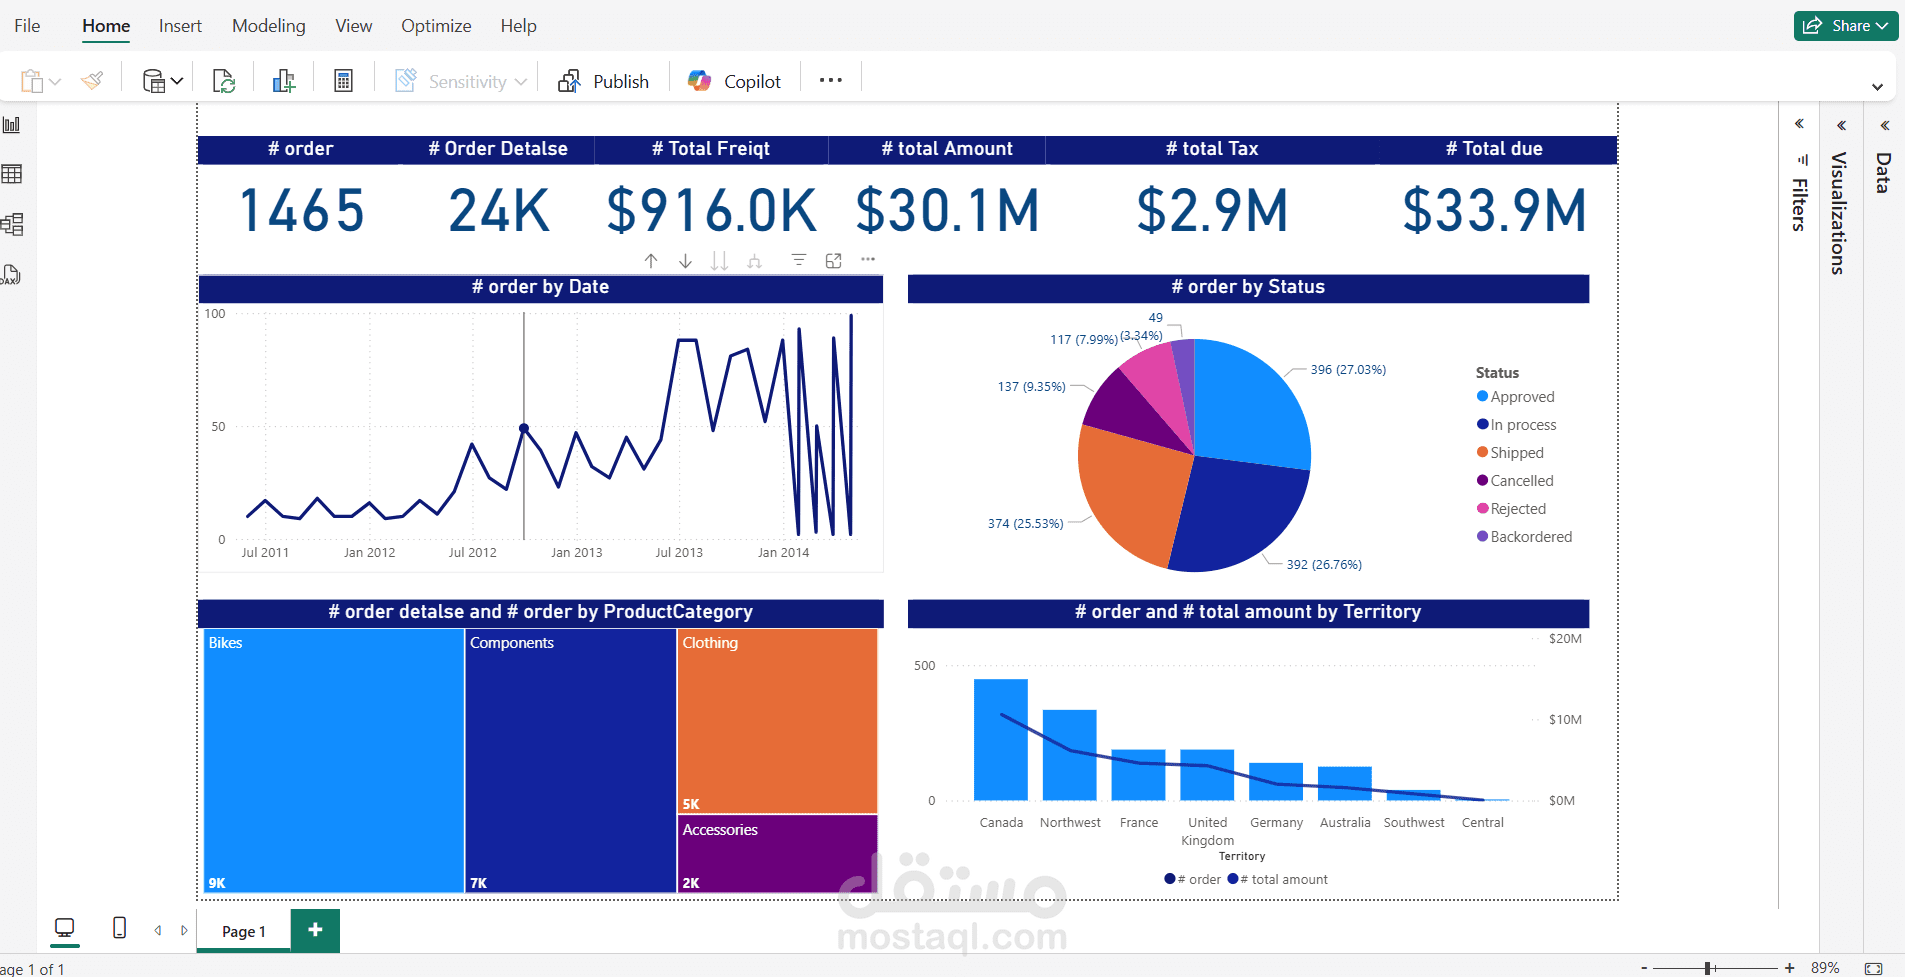
This Power BI dashboard provides a comprehensive overview of our sales performance. It highlights key metrics such as total orders (1,465), order details (24K), freight cost (\$916K), total amount (\$30.1M), tax (\$2.9M), and total due (\$33.9M). Visualizations include order trends over time, order distribution by status and product category, and sales performance by territory. Canada leads in both order volume and revenue. The dashboard enables data-driven insights for decision-making, helping us monitor operations, identify top-performing regions and products, and optimize logistics and sales strategies. It is an essential tool for improving our business performance and strategic planning.
