Data analysis With Python
تفاصيل العمل

The project "Investigate a Dataset for Smartphone" focuses on analyzing smartphone data to answer research questions about pricing and brand distribution. It uses Python in a Jupyter Notebook environment for data analysis and visualization.
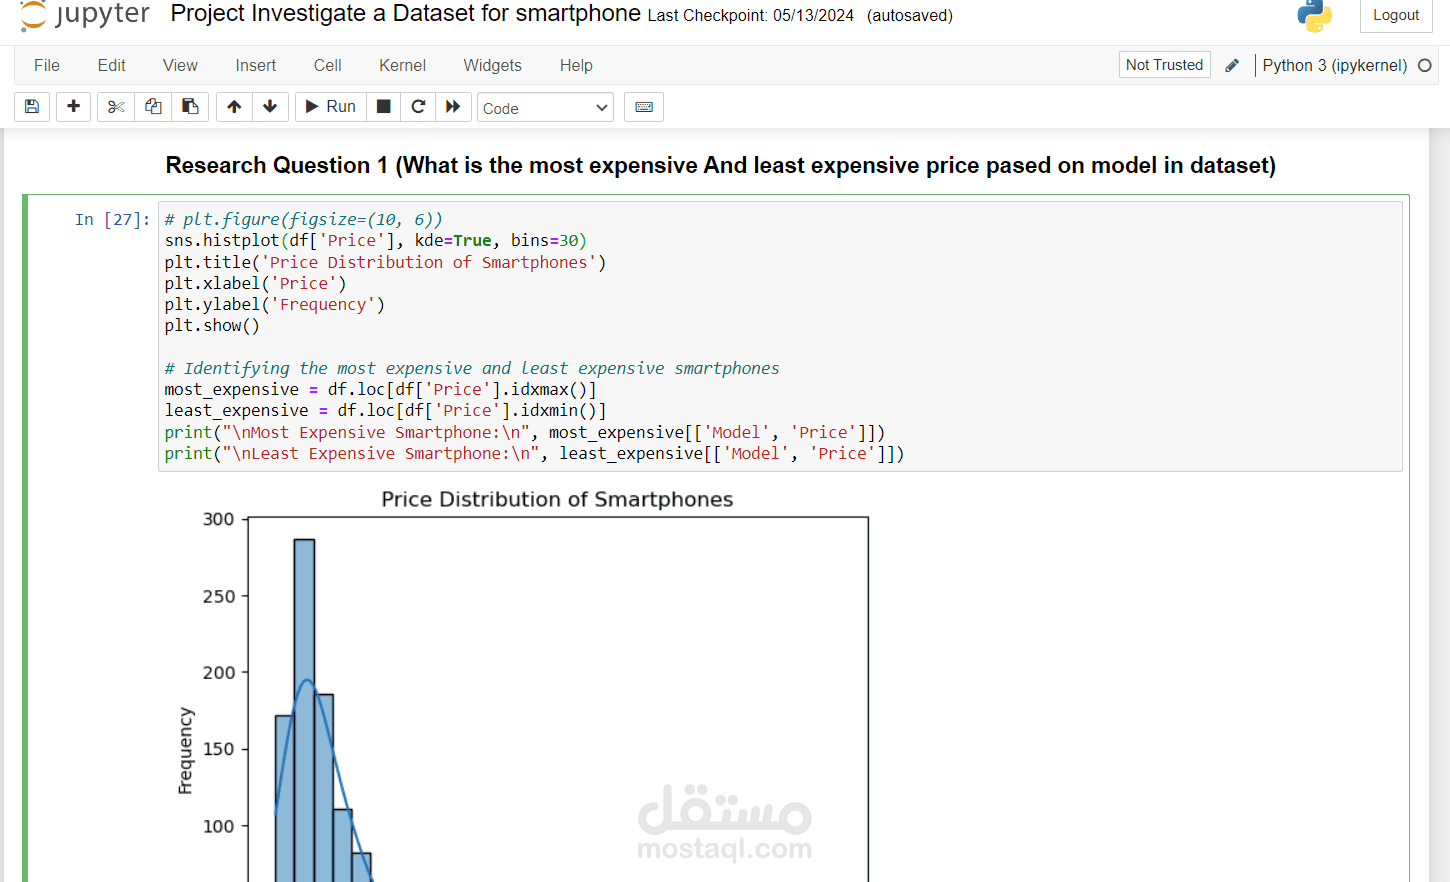
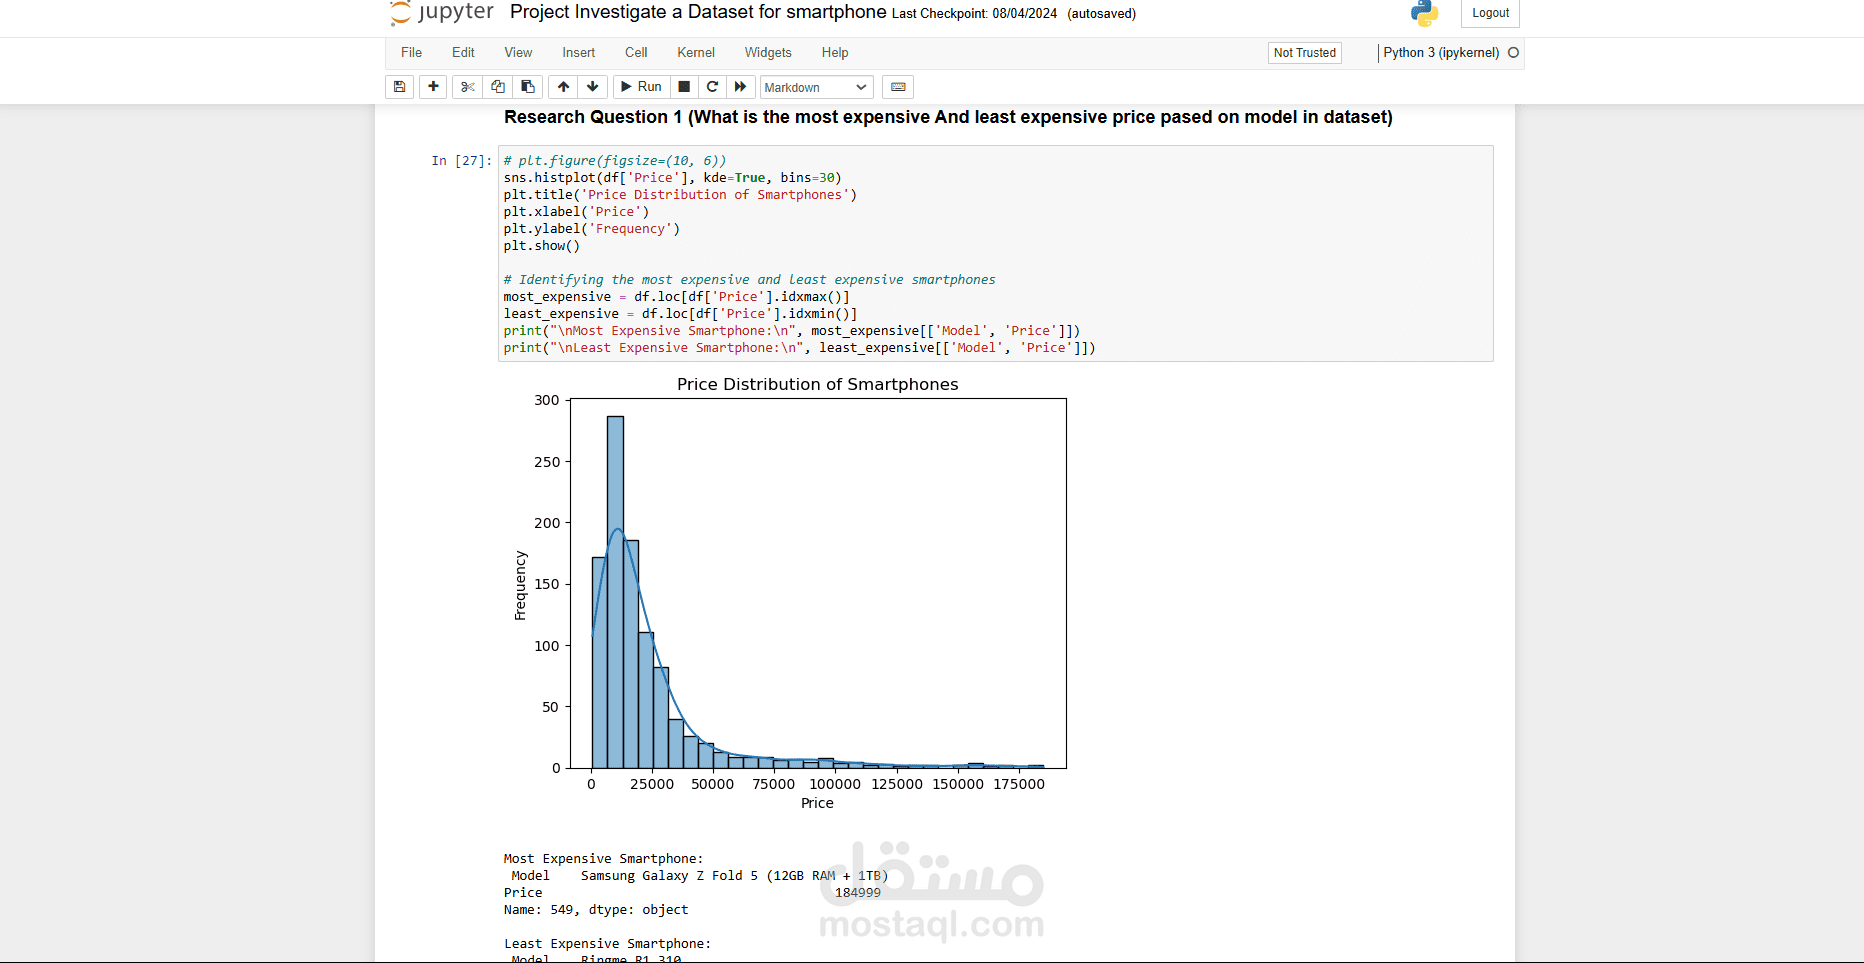
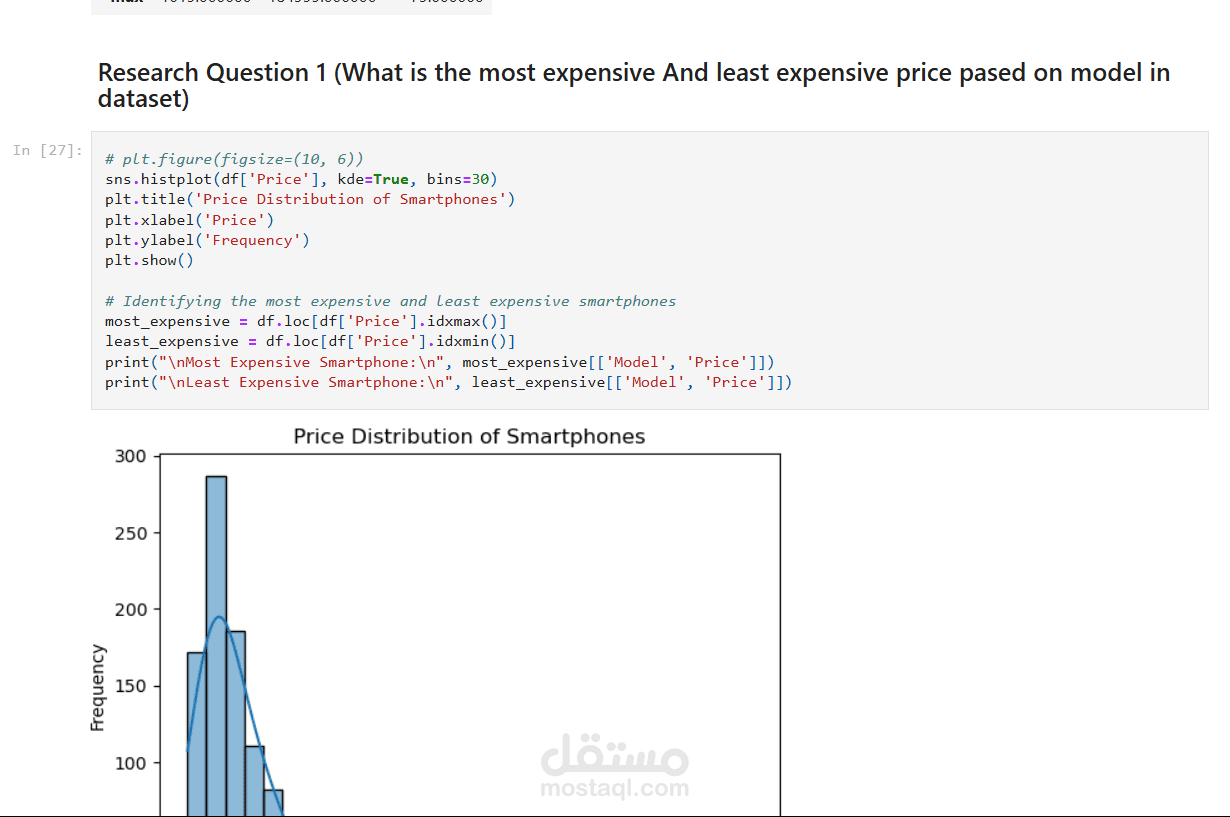
*Research Question 1* explores the most and least expensive smartphone models. A histogram visualizes the price distribution, showing most smartphones are priced below $5000, with a long tail extending to $18,499. The most expensive model identified is the "Samsung Galaxy Z Fold 5 (12GB RAM + 1TB)" priced at $18,499, while the least expensive is the "Nokia 216" at $549.
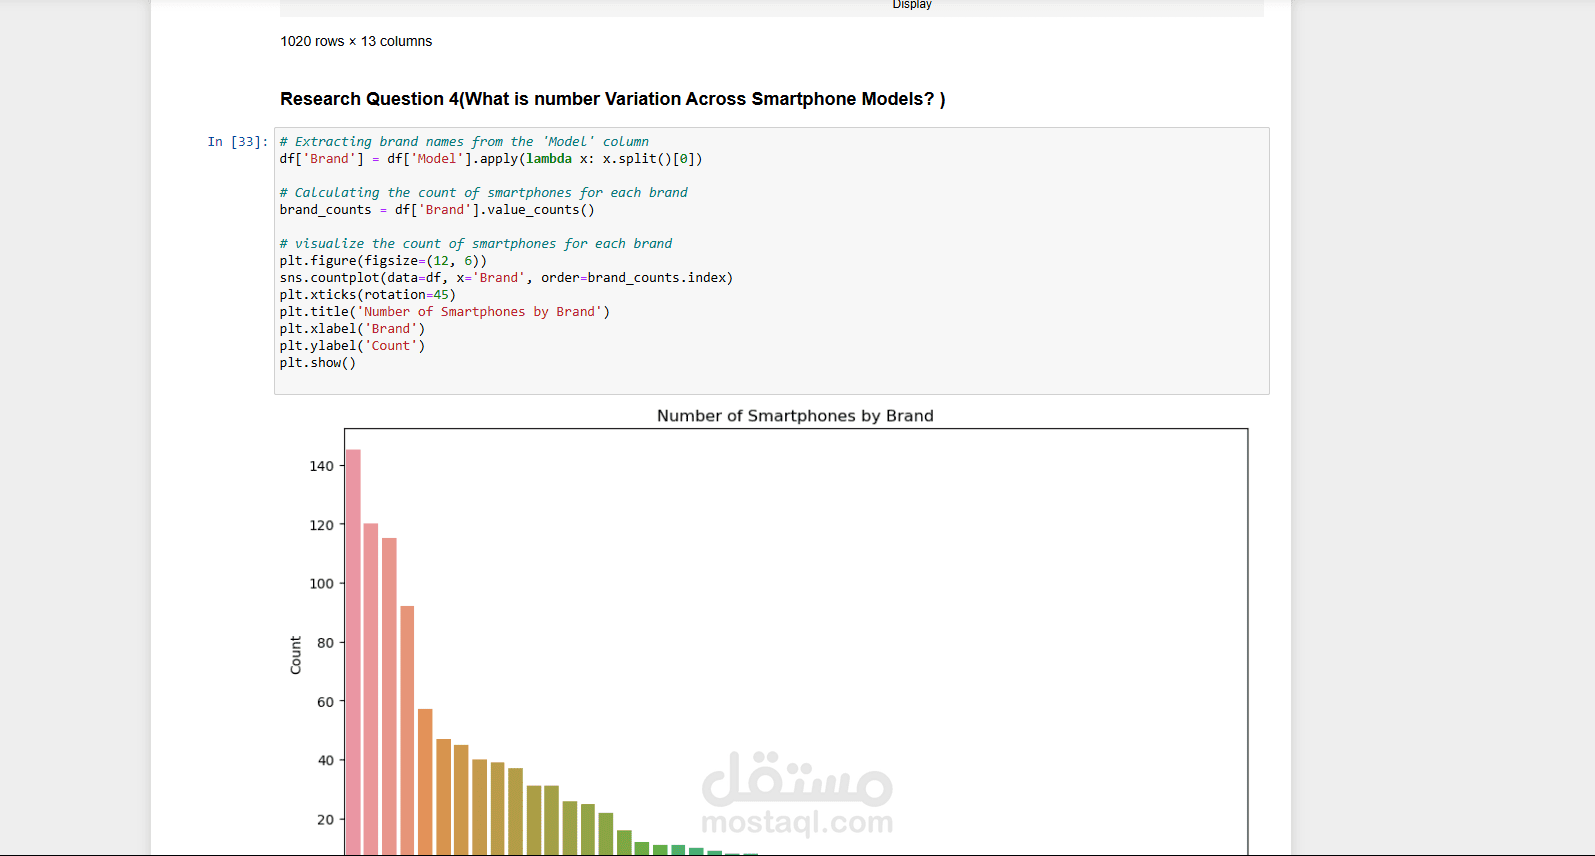
*Research Question 4* examines the variation of smartphones across brands. A bar plot displays the count of smartphones per brand, revealing one brand (likely Samsung, based on the data) dominates with around 140 models, while others have fewer models, decreasing progressively.
The project involves exploratory data analysis (EDA) with a dataset of 1020 rows and 13 columns, using libraries like Pandas, Seaborn, and Matplotlib for data manipulation and visualization. Although you mentioned a supermarket dataset, the images provided are about smartphones, so I’ve described that analysis. If you have a specific supermarket dataset, please share more details!
Regarding deployment, you mentioned using Gradio and hosting on Hugging Face, which allows users to interact with your analysis or model through a web interface, making it accessible for real-time insights.