Road Accident Analysis - PowerBI
تفاصيل العمل
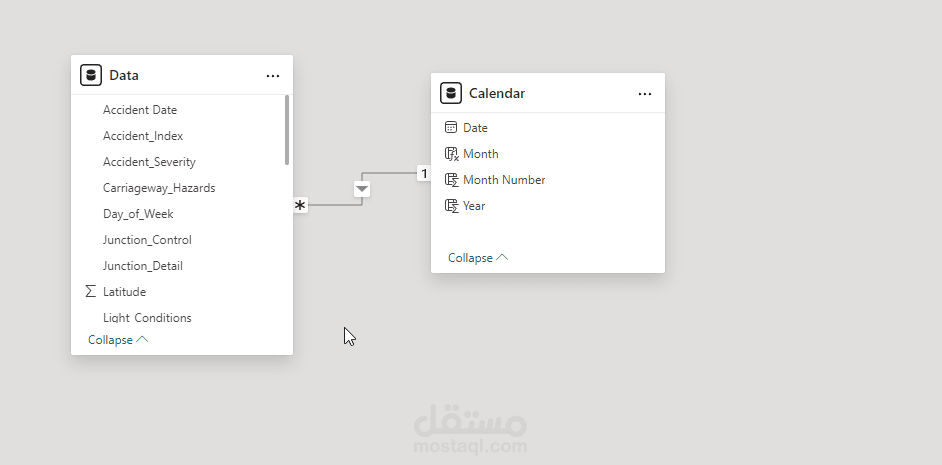
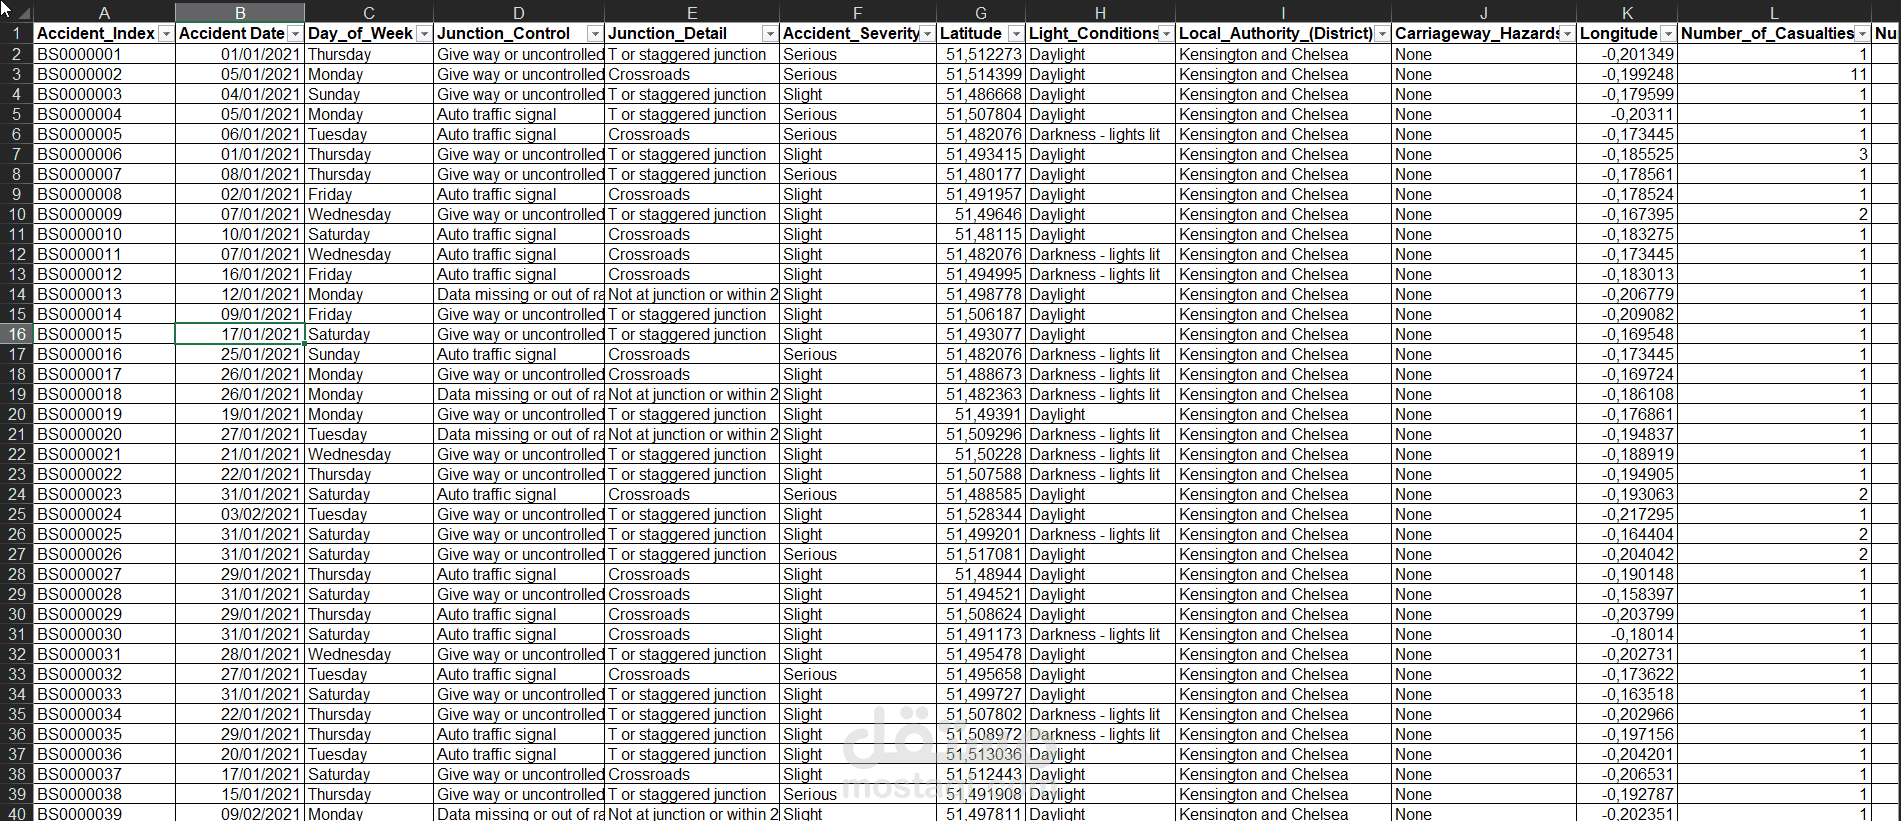
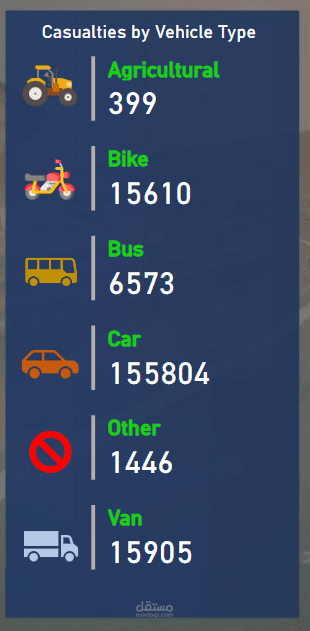
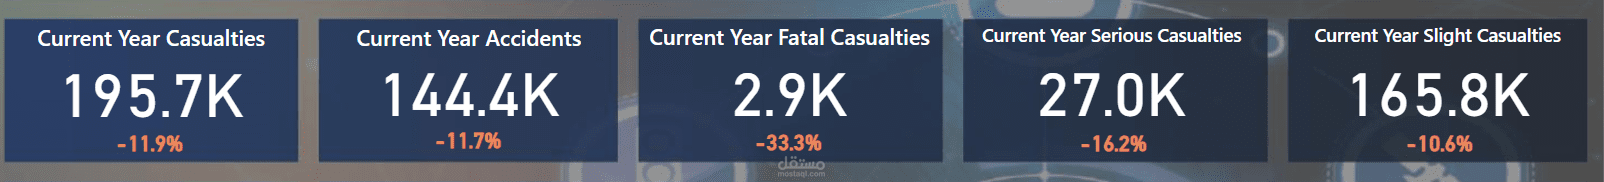
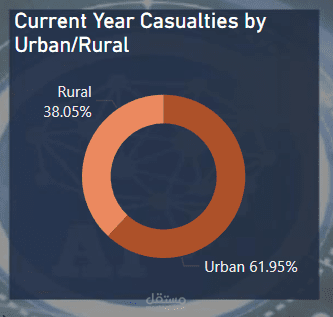
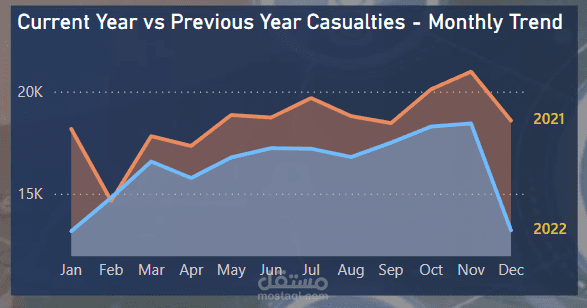
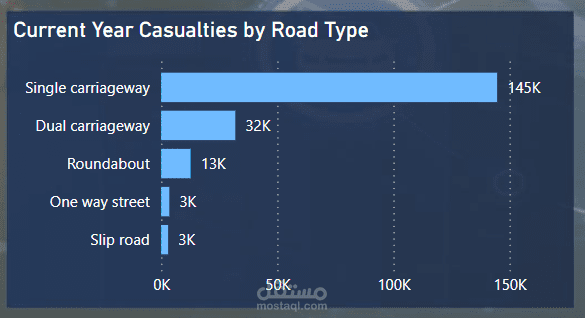
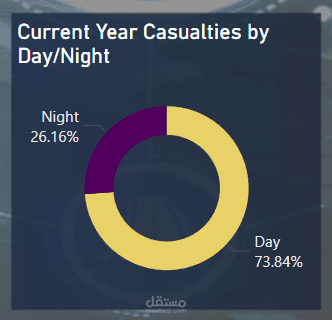

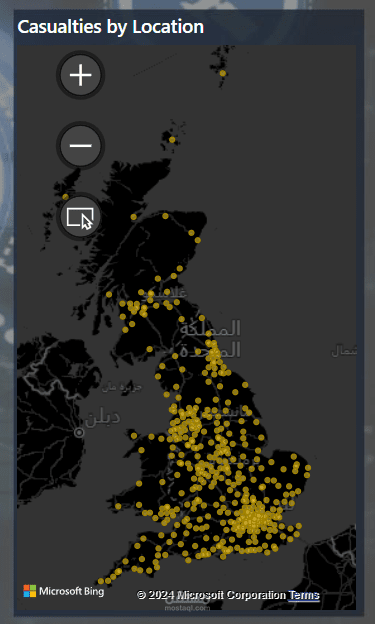
This project is an interactive Power BI dashboard that shows us insights derived from a dataset on road accidents in the United Kingdom during the years 2021 and 2022. It shows different types of insights about accident data such as YoY growth, location, time of the day, type of road, type of vehicle and type of area. It also shows a breakdown by severity of the accident and casualties. It also contains filters that help you see insights only for a specific weather condition or road
surface type.