Startup Expansion Dashboard | Power BI Project
تفاصيل العمل
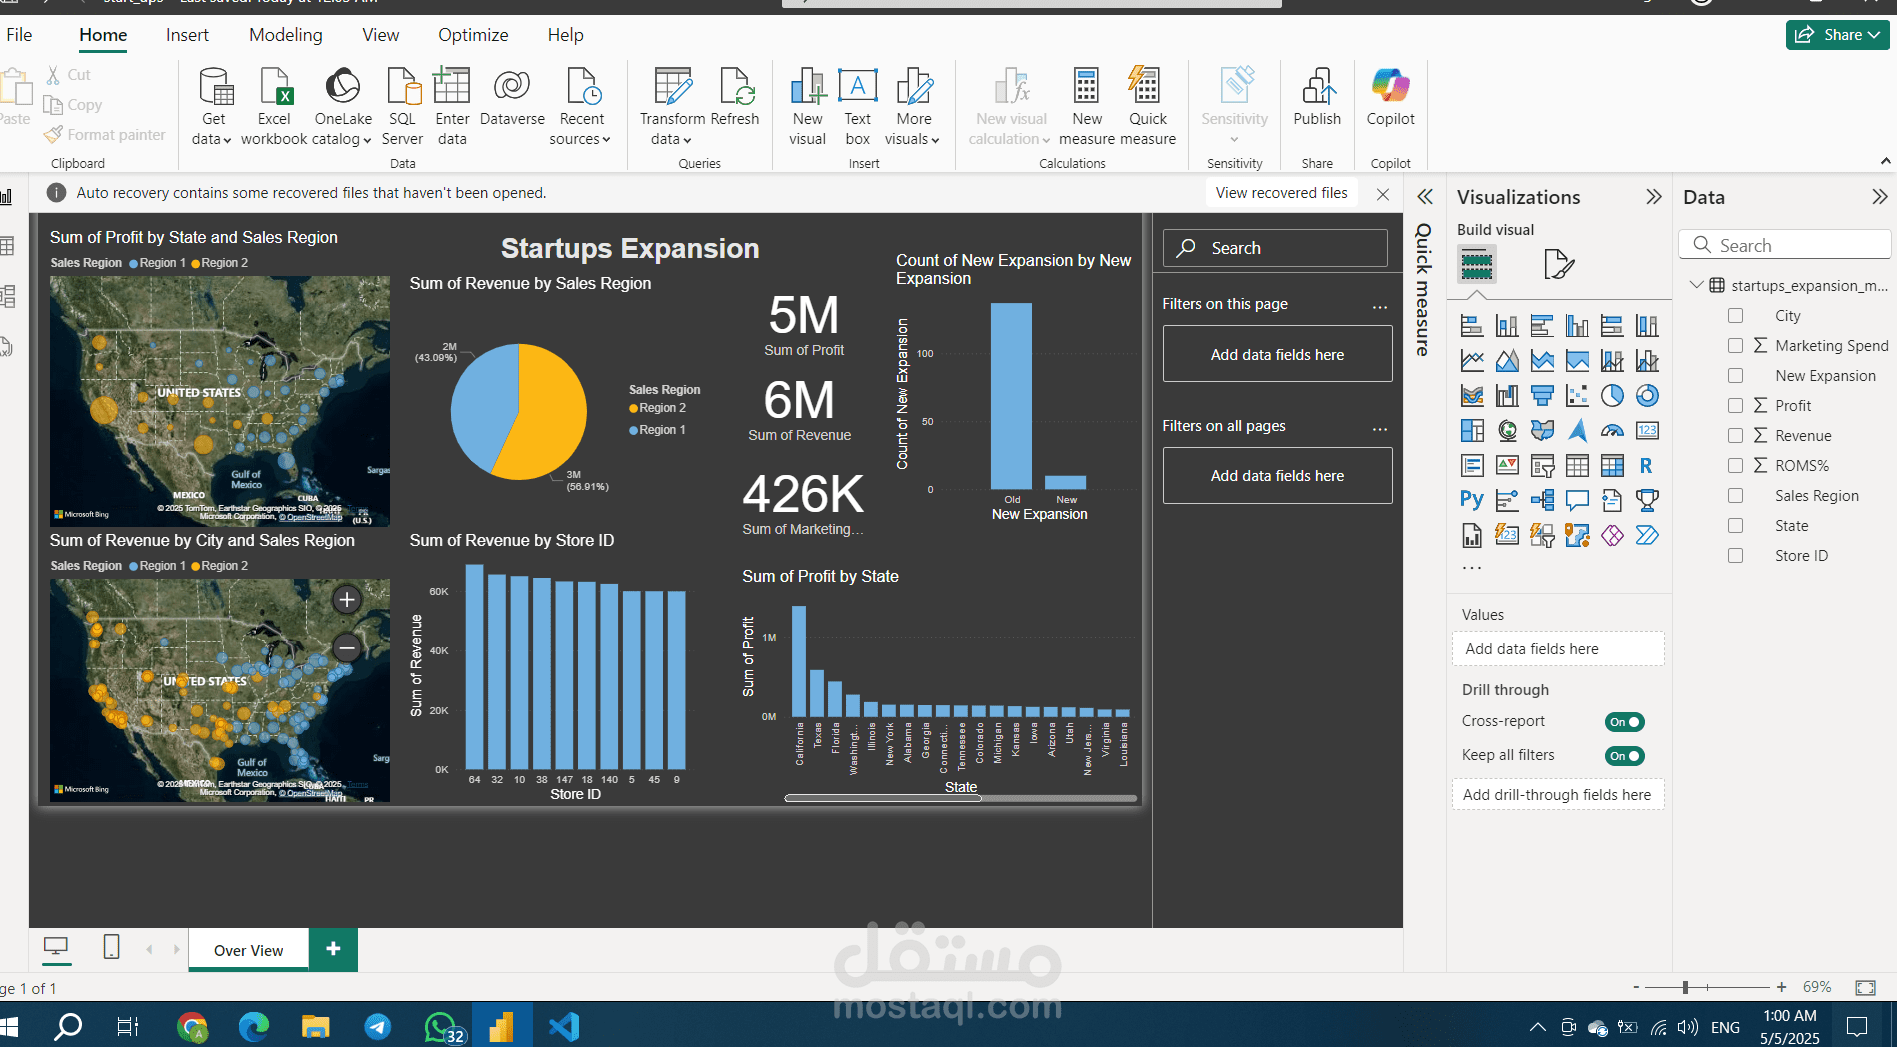
In this project, I built a fully interactive Power BI dashboard to analyze startup expansion performance across U.S. regions. Using Python (Pandas, Plotly, Seaborn), I cleaned and explored data from 150 stores, covering location, revenue, marketing spend, and expansion status.
The Power BI dashboard includes:
Dynamic KPIs for revenue, profit, and marketing spend
Geo maps to visualize performance by city and state
Pie and bar charts to compare old vs. new expansions
This dashboard helps decision-makers identify high-performIn this project,