واجهة BI
تفاصيل العمل
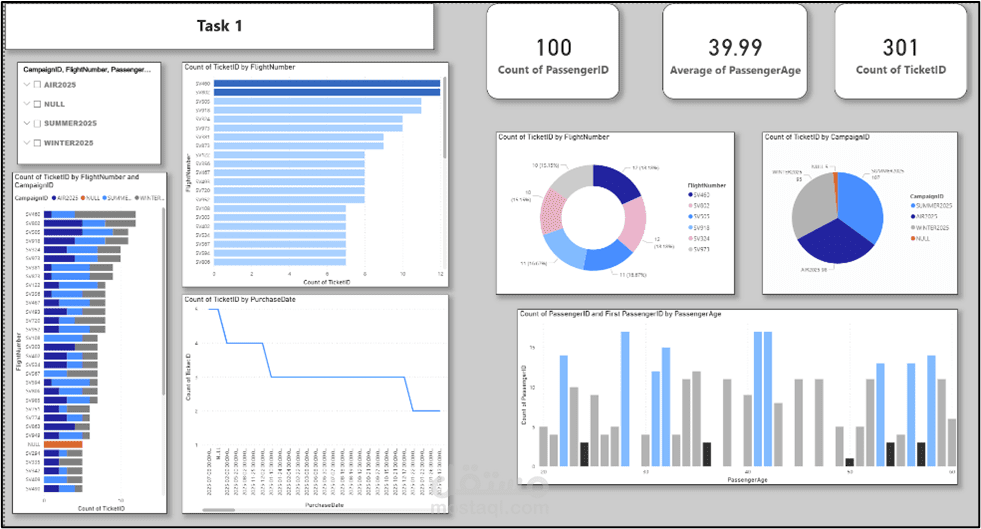
The image features a set of charts designed using Power BI. It includes vertical bar charts that visually display data distribution, along with pie charts that illustrate the proportions of various categories. The organized layout facilitates understanding of patterns and trends, providing a comprehensive overview of the information. These elements work together to deliver an accurate and thorough analysis that supports effective decision-making.