Netflix Movies Dashboard | Data Analysis & Visualization
تفاصيل العمل
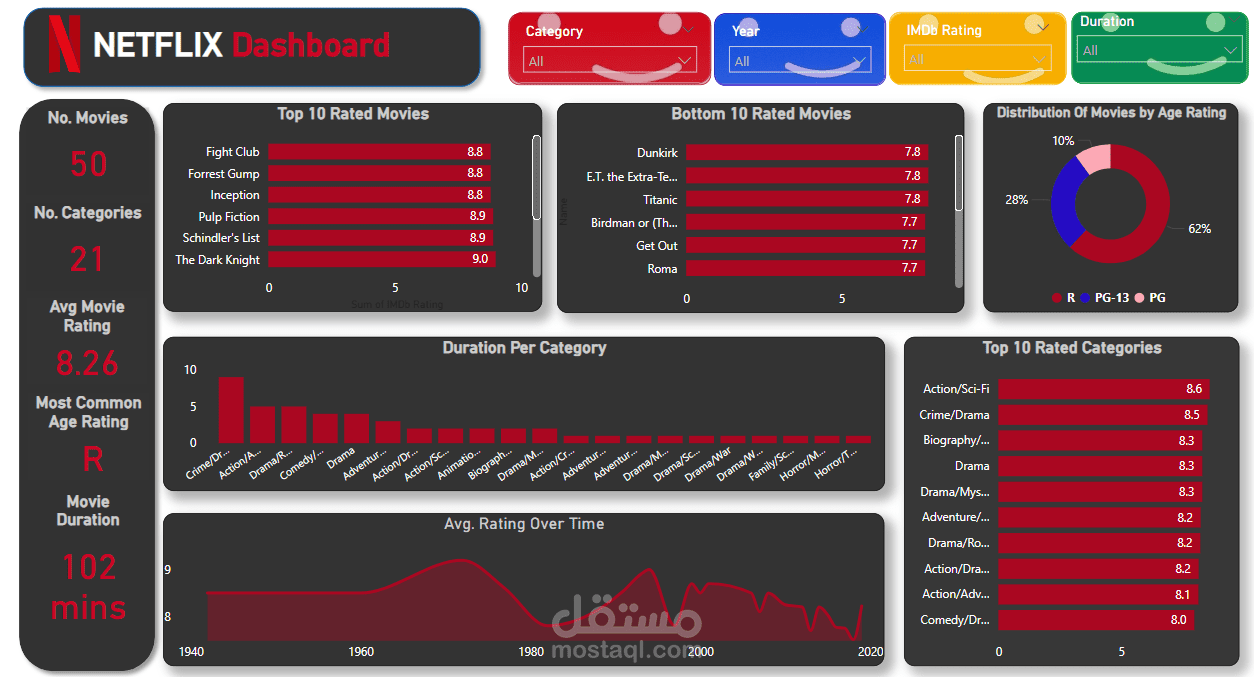
This project is a dynamic Power BI dashboard built to analyze a dataset of 50 Netflix movies. It aims to provide deep insights into movie ratings, durations, categories, and audience age restrictions.
? Key Questions Answered in the Dashboard:
What is the total number of movies available?
What is the total duration of all movies in hours?
How many movies are available per year?
What is the distribution of movies by age rating?
Which year had the highest average IMDb rating?
Which category has the highest average IMDb rating?
How does movie duration vary by category?
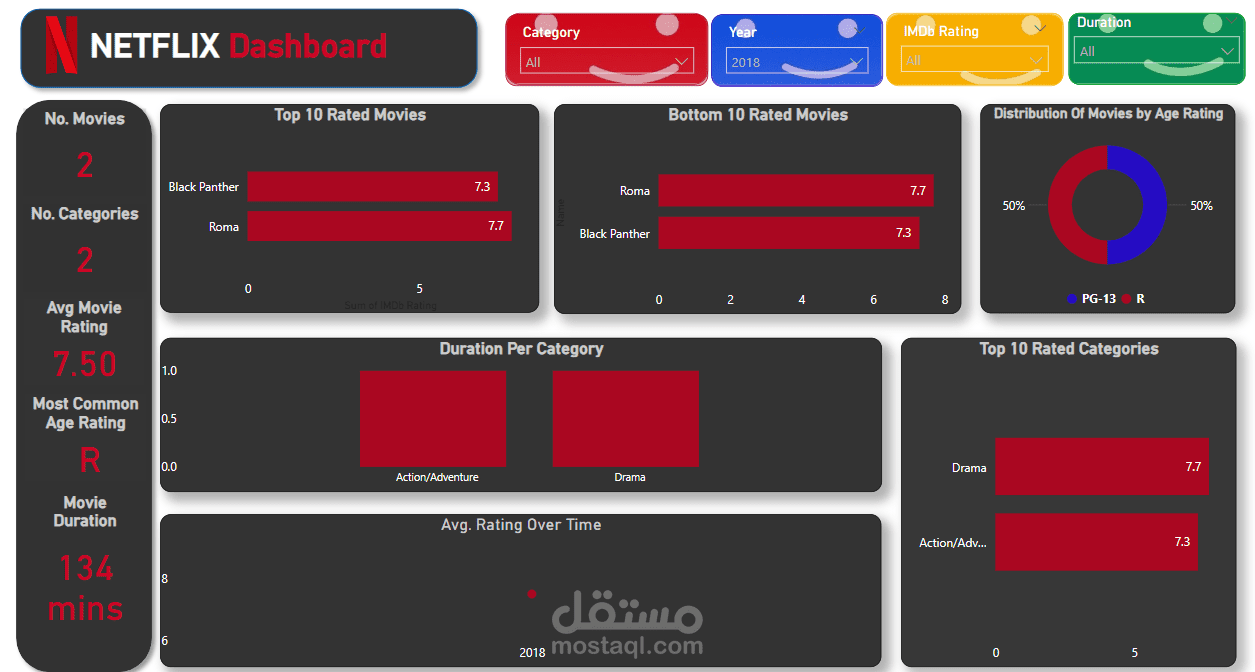
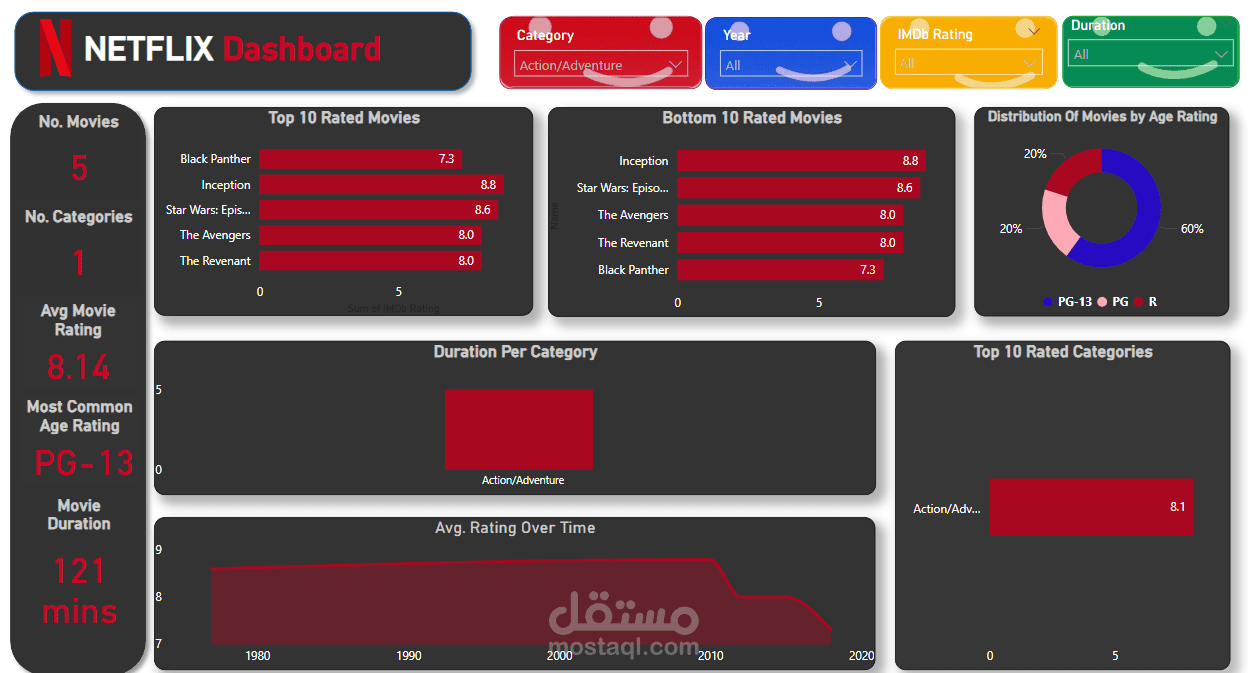
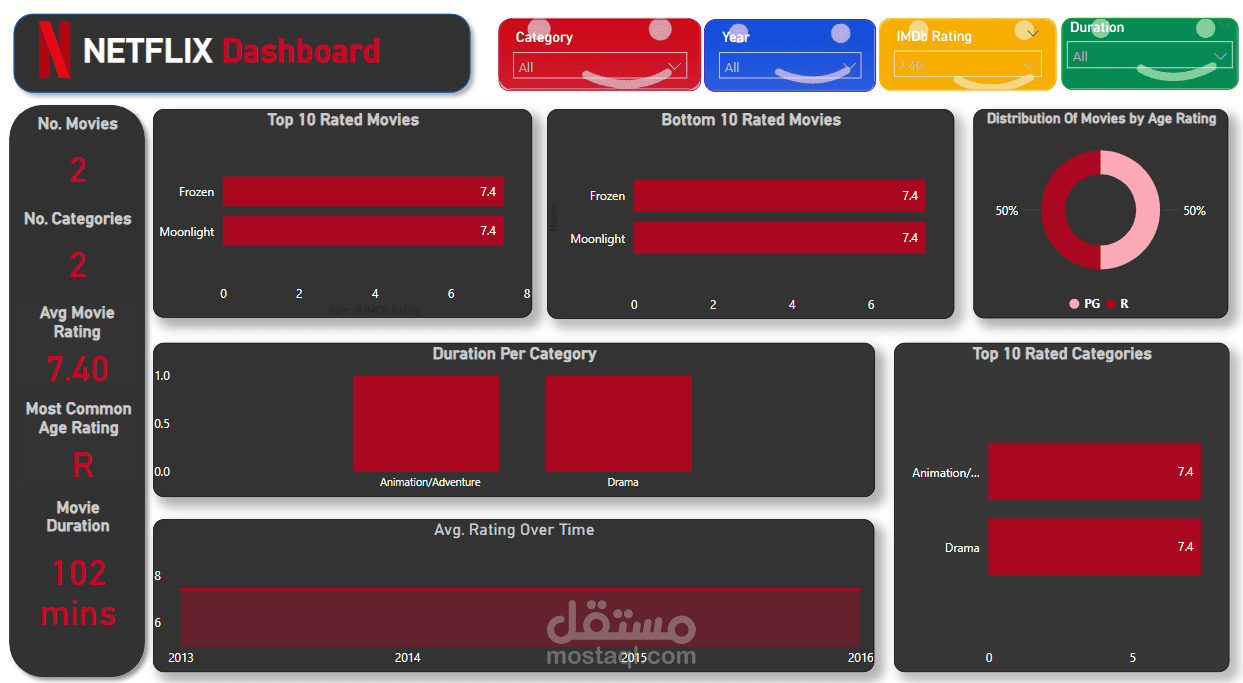
Dashboard Features:
Interactive slicers (Category, Year, IMDb Rating, Duration)
Top 10 & Bottom 10 rated movies
Age rating distribution pie chart
Ratings over time line chart
Duration by category
Top 10 highest-rated genres
Insights Discovered:
The Dark Knight is the highest-rated movie with a 9.0 IMDb score.
Action/Sci-Fi is the top-rated category with an average of 8.6.
Movies rated "R" dominate the dataset (62%).
Crime/Drama and Drama/Romance have the longest durations on average.
IMDb ratings peaked during the late 1990s and early 2000s.
Even the bottom 10 rated movies scored 7.0 or higher, showing consistent quality.
Hybrid genres like Biography/Drama and Drama/Mystery receive higher ratings.
Most movies were produced between the 1980s and 2010s.
The total viewing time is around 85 hours.
Tools Used:
Power BI for dashboard creation and interactivity
Data Cleaning & Modeling in Power Query
This project demonstrates my ability to explore, clean, and visualize data in a way that uncovers meaningful business insights and trends. It's perfect for anyone interested in content strategy, viewer preferences, or general data storytelling.