Order Analysis Dashboard
تفاصيل العمل
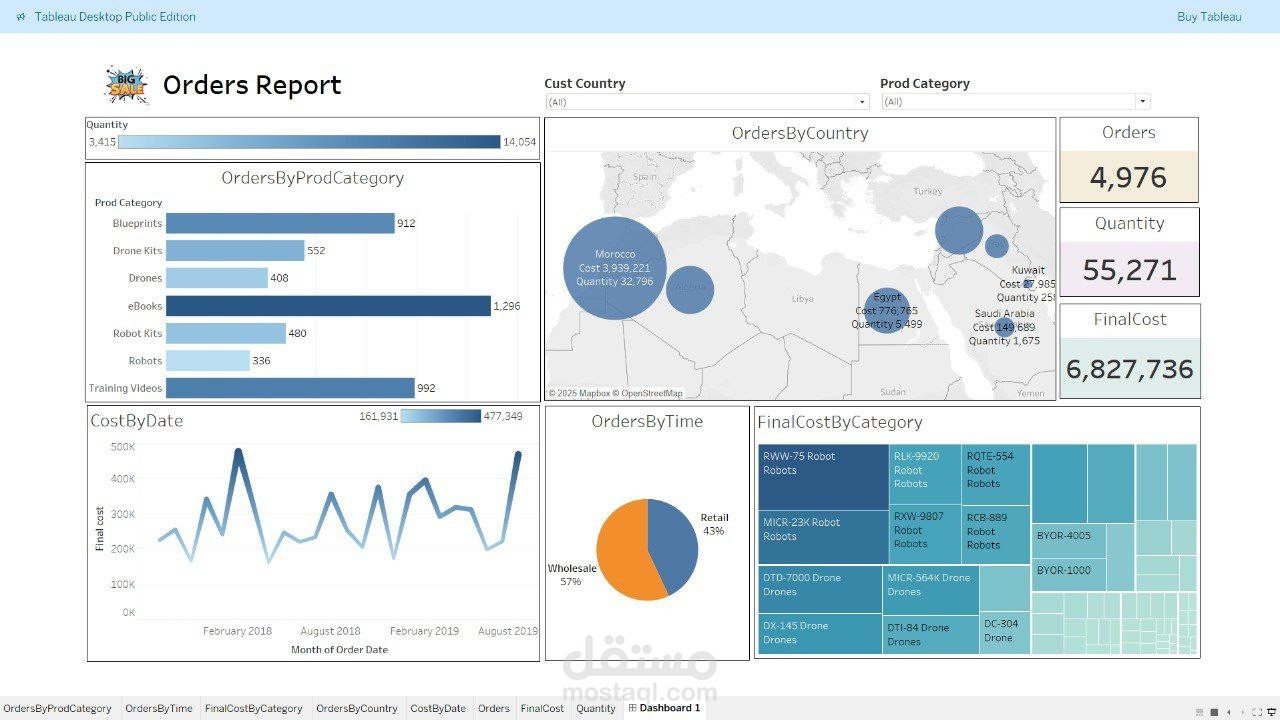

Excited to share my first project using Tableau This interactive dashboard provides insights into order data, helping businesses make data-driven decisions.
Key Insights from the Dashboard:
Orders by Product Category :
A breakdown of orders by category, showing that eBooks and Training Videos have the highest demand.
Orders by Country :
A geographical analysis highlighting that Morocco has the highest total cost and order quantity, followed by Egypt and Kuwait.
Cost Over Time :
A trend analysis of total cost across different months, helping identify peak and low sales periods.
Orders by Time :
A comparison between retail (43%) and wholesale (57%) orders, showing that wholesale plays a larger role in overall sales.
Final Cost by Category :
A detailed cost distribution per product type, identifying the most expensive and high-impact items.