تحليل بيانات
تفاصيل العمل
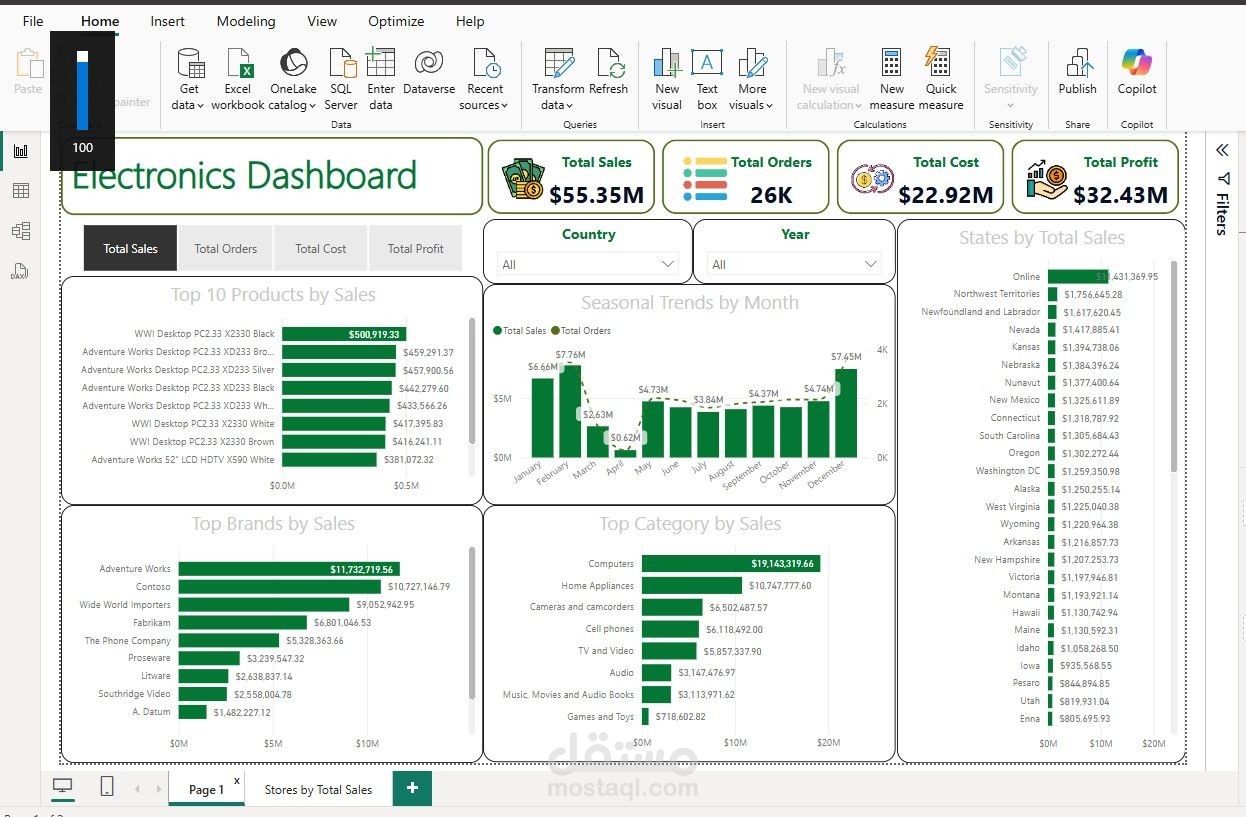
project: Electronics Sales Analysis Dashboard – built using Power BI as part of my training with the Digital Egypt Pioneers Initiative - DEPI.
which I developed during my learning and training period under the supervision of my instructor Maged Magdy .
This project was an amazing opportunity to apply my skills in data wrangling, business intelligence, and interactive reporting, under the mentorship of experienced instructors during my learning journey. Project Overview: The dashboard provides in-depth insights into electronics sales performance across multiple dimensions – including products, geography, customers, store attributes, delivery trends, and currency effects. Key Analysis Areas: Top-performing products, brands, and categories by revenue Sales trends across states, countries, and stores Seasonal trends and their impact on order volume and delivery speed Customer demographics and behavior (gender, age group, region) Currency exchange rate impact on revenue in global markets Profitability insights by brand, category, and store performance Key Skills Applied & Developed: Power BI dashboards and storytelling SQL for complex queries and data extraction DAX for advanced calculations Data modeling and transformation Business insights and decision support Key Findings: Certain product categories dominate revenue across specific countries and store types. Delivery times are slower during peak sales seasons – especially for large orders. Exchange rate fluctuations significantly impact revenue in non-USD markets. Profit margins vary greatly between brands and product categories.